Real-time Intelligence - Microsoft Fabric
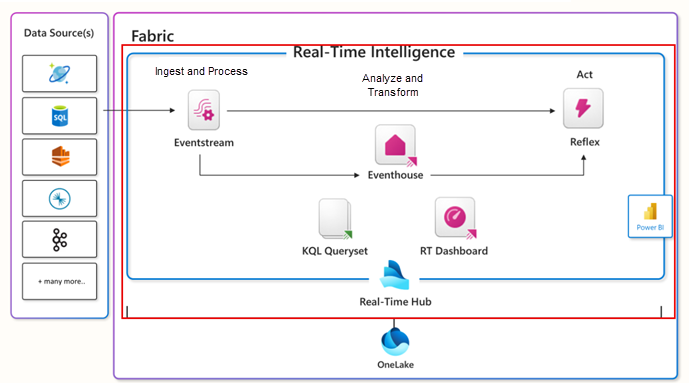
Core elements of Real-Time Intelligence in Microsoft Fabric

Eventhouse

- Central workspace/hub - has multiple KQL databases
- Use an Eventhouse for event-based scenarios
- Automatically index and partition data based on ingestion time
- When you create an EventHouse, it initializes a KQL database with the same name inside it
- KQL databses can be standalone or part of an EventHouse
- Can ingest data from multiple sources

KQL Database

A KQL (Kusto Query Language) Database handles large volumes of structured, semi-structured, and unstructured data for real-time analytics and ad-hoc querying. It is part of the Azure Data Explorer service. The data in a KQL database is stored in Azure Data Explorer. It uses a columnar storage format, for high-performance.
KQL Queryset
It is a just a query written in KQL. Let’s not make it more complex than that!
Real-Time Dashboards
- Customizable control panels for displaying specific data.
- Tiles for different data views, organized on various pages.
- Export KQL queries into visual tiles.
- Enhances data exploration and visualization.
Eventstream

- Handles live data without coding.
- Automates data collection, transformation, and distribution.
- Processes real-time data for immediate insights.
Let’s Get Started
-
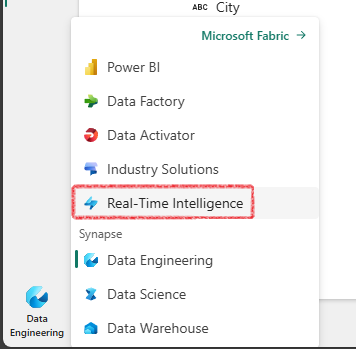
Open Real-Time Intelligence: Select it from the bottom left-hand corner of the screen:
-
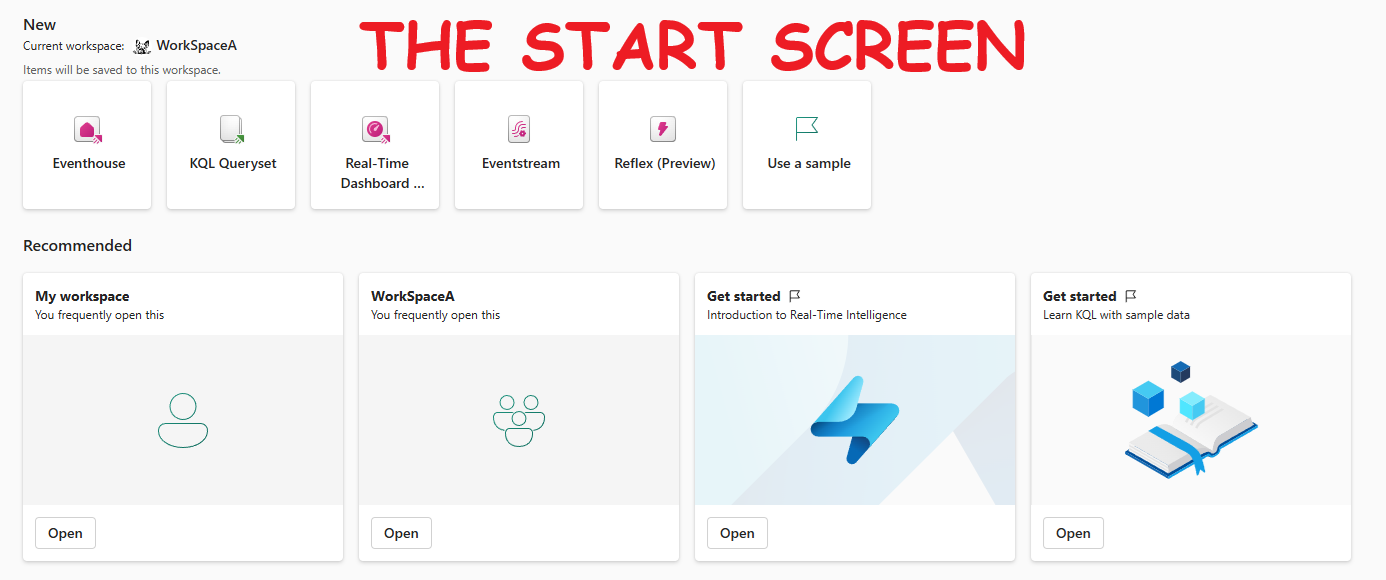
Start Screen: Here is how it looks:
-
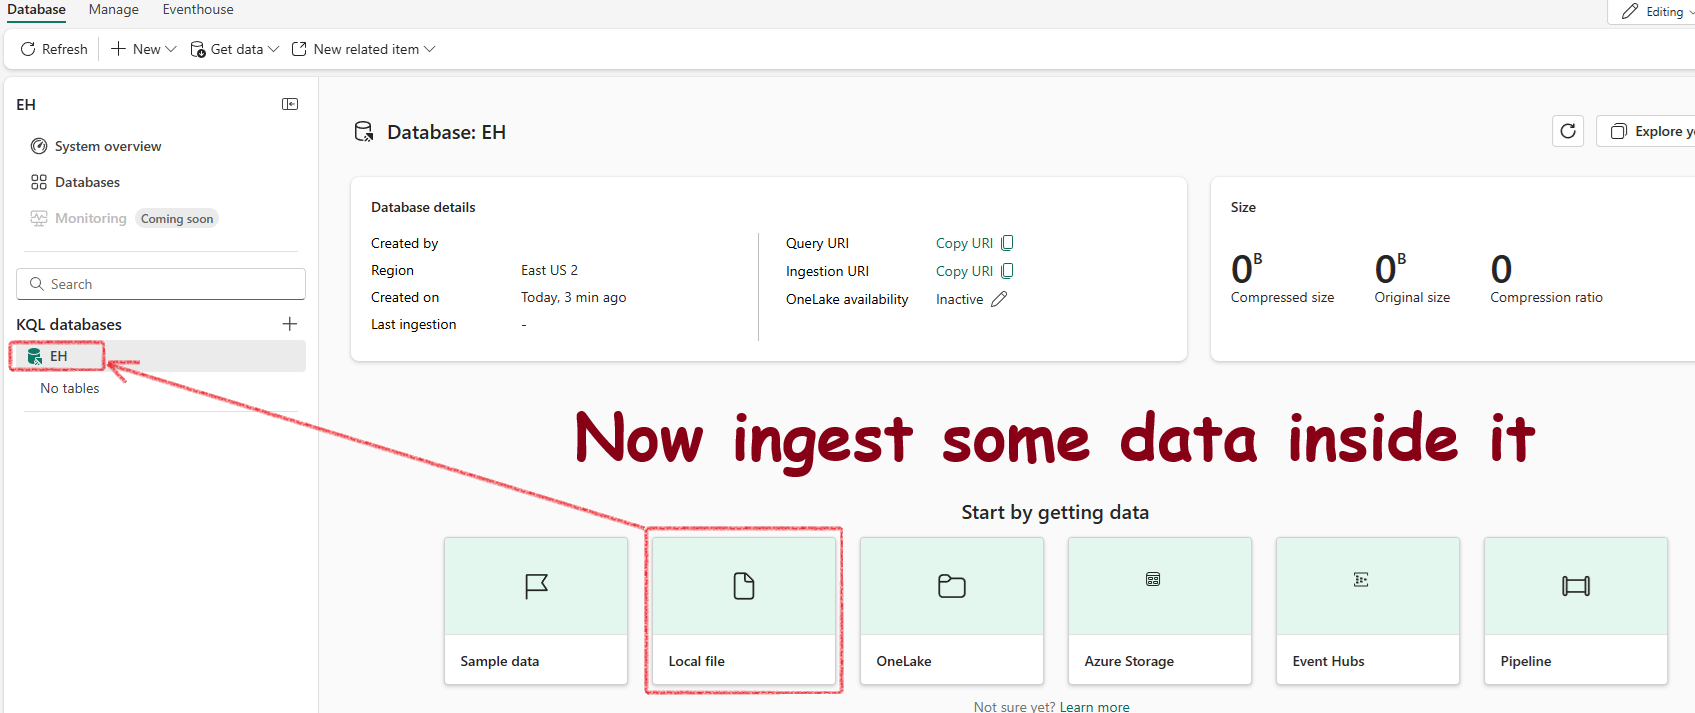
Create an Eventhouse: Eventhouses are groups of databases. When you create an Eventhouse, Fabric creates a KQL Database with the same name inside it
-
KQL Database Structure: This is the standard structure:
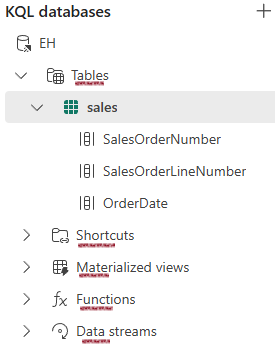
Data Ingestion: Importing data from files like .csv is a childs play using the GUI, which creates a fully structured database with the correct columns.
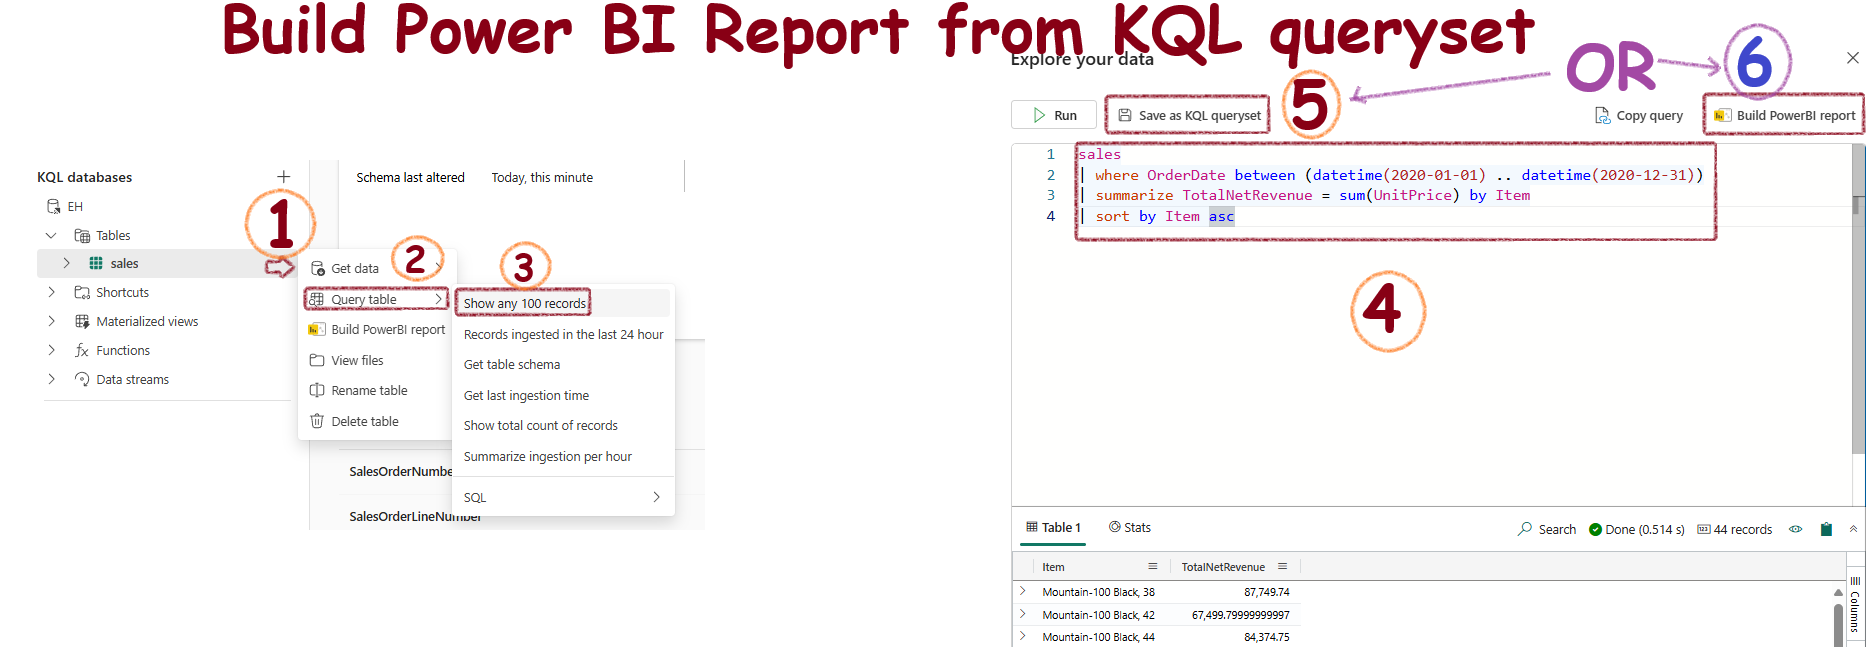
Create a Power BI Report from KQL Queryset
- Click the three dots next to the table.
- Select “Show any 100 records” to open the KQL editor.
- Create your custom KQL query.
- Save the query or create the Power BI report directly from the editor.
