Common machine learning models
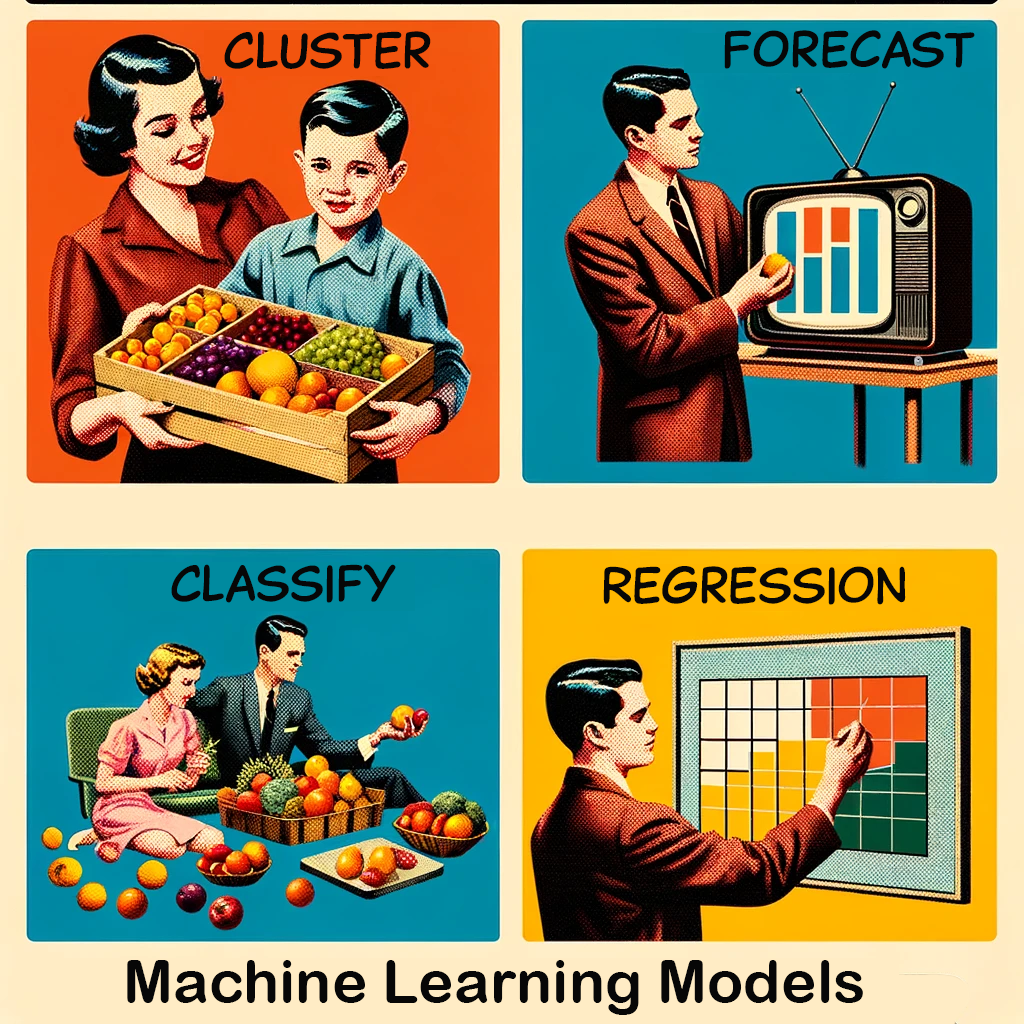
- Classification: Will the customer stay or leave?
- Regression: What will the product cost?
- Clustering: Group similar customers together.
- Forecasting: What will sales be next month?
Let’s get started
Go to your workspace and click on Data Science on the left corner icon
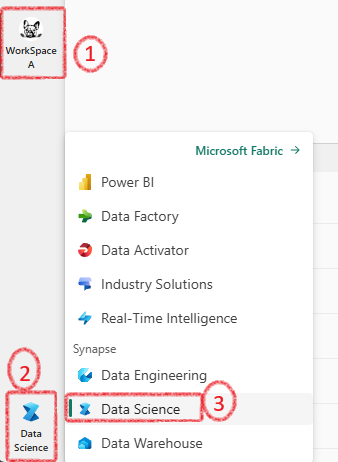
Now from the landing page click on Notebook

Now your notebook will open, You can add your lakehouse from the left side pane:

In the notebook, paste this read-made microsoft code:
# Azure storage access info for open dataset diabetes
blob_account_name = "azureopendatastorage"
blob_container_name = "mlsamples"
blob_relative_path = "diabetes"
blob_sas_token = r"" # Blank since container is Anonymous access

# Set Spark config to access  blob storage
wasbs_path = f"wasbs://%s@%s.blob.core.windows.net/%s" % (blob_container_name, blob_account_name, blob_relative_path)
spark.conf.set("fs.azure.sas.%s.%s.blob.core.windows.net" % (blob_container_name, blob_account_name), blob_sas_token)
print("Remote blob path: " + wasbs_path)

# Spark read parquet, note that it won't load any data yet by now
df = spark.read.parquet(wasbs_path)
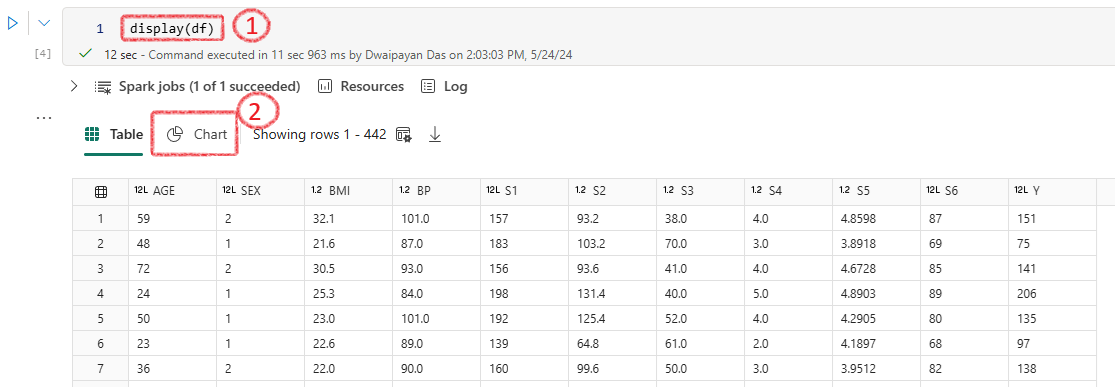
Fabric automatically creates the spark session and the df is created. Now lets see the df
Enter python display(df) in the next cell to see the output
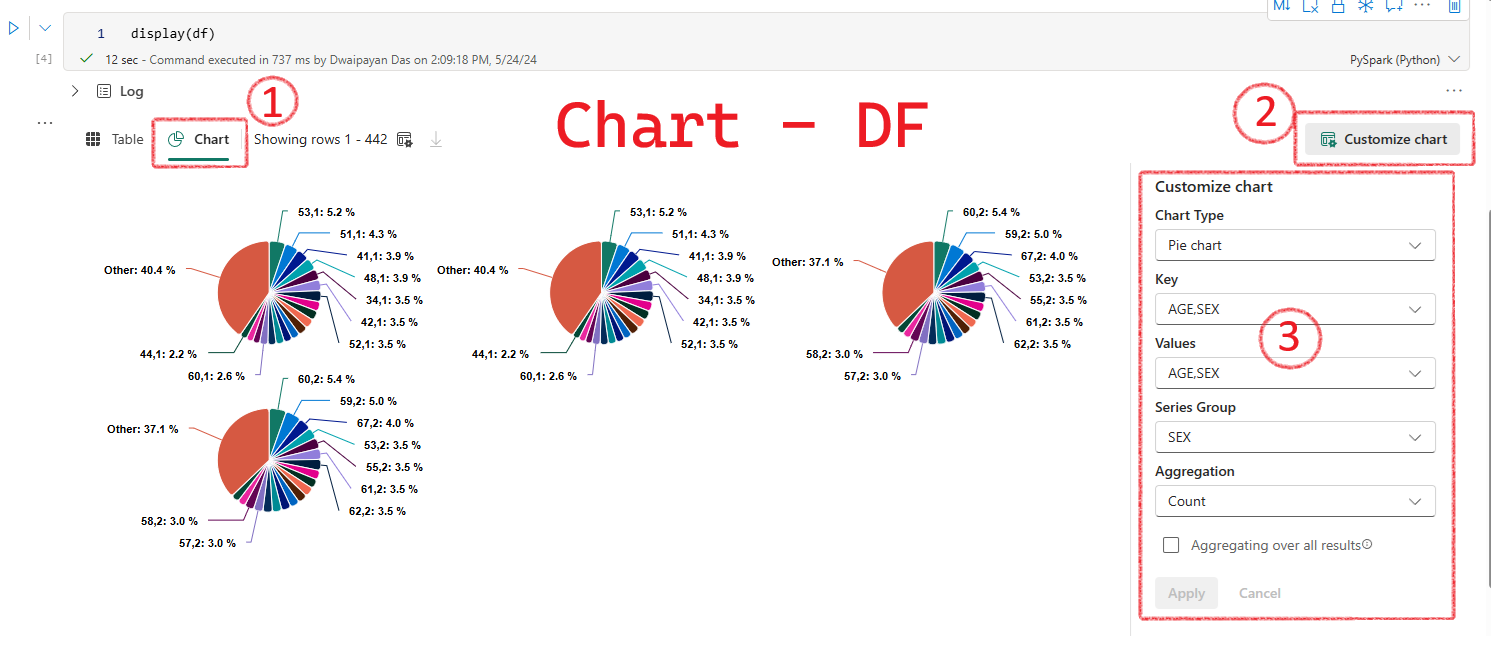
With display(df) the output will show two options Table and Chart. Select Chart
Then you can customize the chart as required
Data Wrangler Tool
The Data Wrangler tool is available at the top of your notebook. First, create a dataframe, then use Data Wrangler to clean it and generate PySpark or Pandas code. It’s a useful tool that saves you from writing a lot of code.
To open Data Wrangler, click on its icon 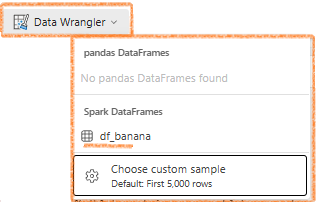 and select the dataframe you created. Make sure your session is active.
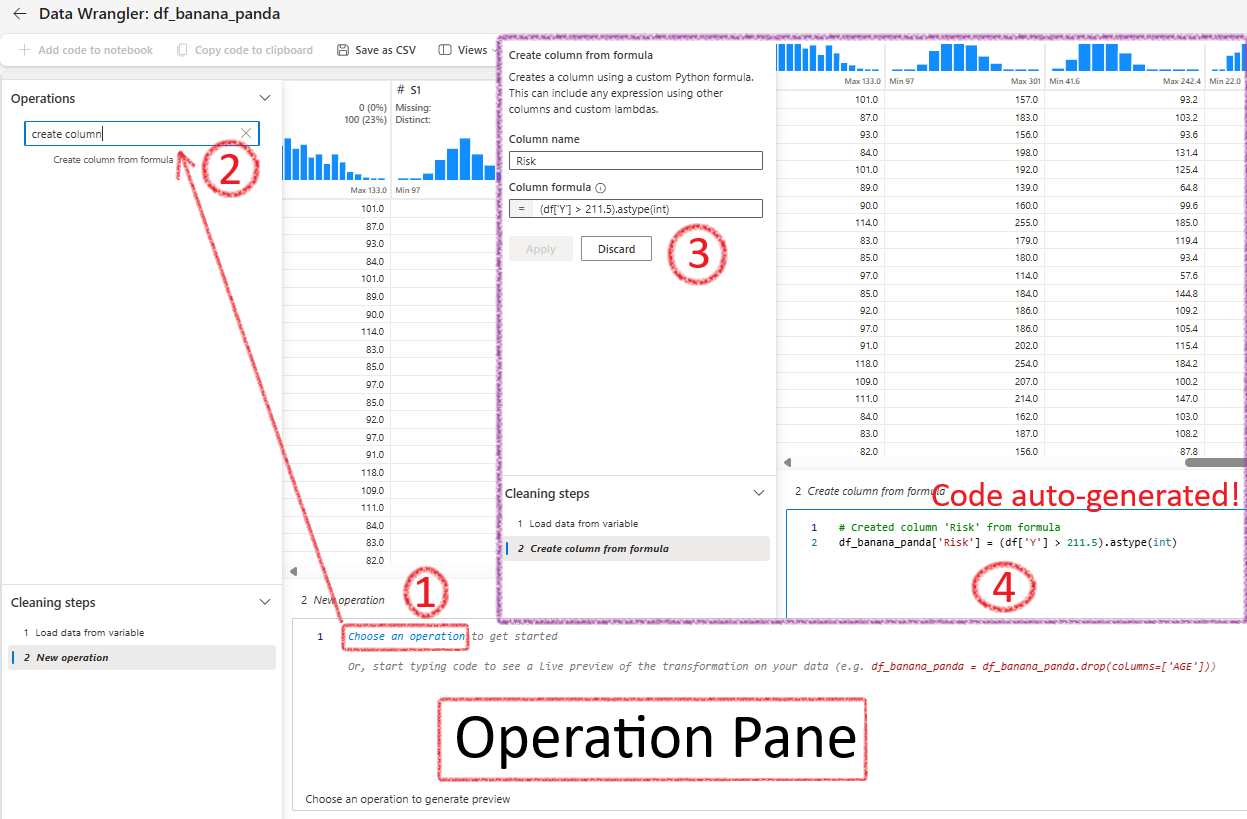
For example, to create a new column, choose Create Column from Formula and provide the details. This formula is only for pandas DF. The corresponding code will be generated automatically!
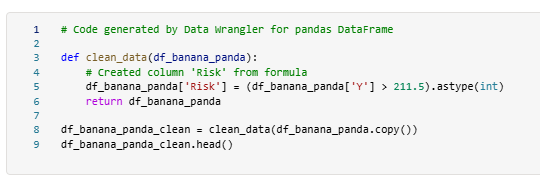
Finally after cleaning Fabric will create a function and add it to the main notebook:
Further steps
Train Machine Learning Models
Train a Regression Model
- Split Data:
from sklearn.model_selection import train_test_split X, y = df_clean[['AGE','SEX','BMI','BP','S1','S2','S3','S4','S5','S6']].values, df_clean['Y'].values X_train, X_test, y_train, y_test = train_test_split(X, y, test_size=0.30, random_state=0) - Create a new experiment
diabetes-regression:import mlflow experiment_name = "diabetes-regression" mlflow.set_experiment(experiment_name) - Train Model:
 from sklearn.linear_model import LinearRegression

 with mlflow.start_run():
    mlflow.autolog()
    model = LinearRegression()
    model.fit(X_train, y_train)
Train a Classification Model
- Split Data:
from sklearn.model_selection import train_test_split X, y = df_clean[['AGE','SEX','BMI','BP','S1','S2','S3','S4','S5','S6']].values, df_clean['Risk'].values X_train, X_test, y_train, y_test = train_test_split(X, y, test_size=0.30, random_state=0) - Create a new experiment
diabetes-classification:import mlflow experiment_name = "diabetes-classification" mlflow.set_experiment(experiment_name) - Train Model:
 from sklearn.linear_model import LogisticRegression

 with mlflow.start_run():
     mlflow.sklearn.autolog()
     model = LogisticRegression(C=1/0.1, solver="liblinear").fit(X_train, y_train)
Explore Your Experiments
- Navigate to your workspace.
- Open the “diabetes-regression” experiment.
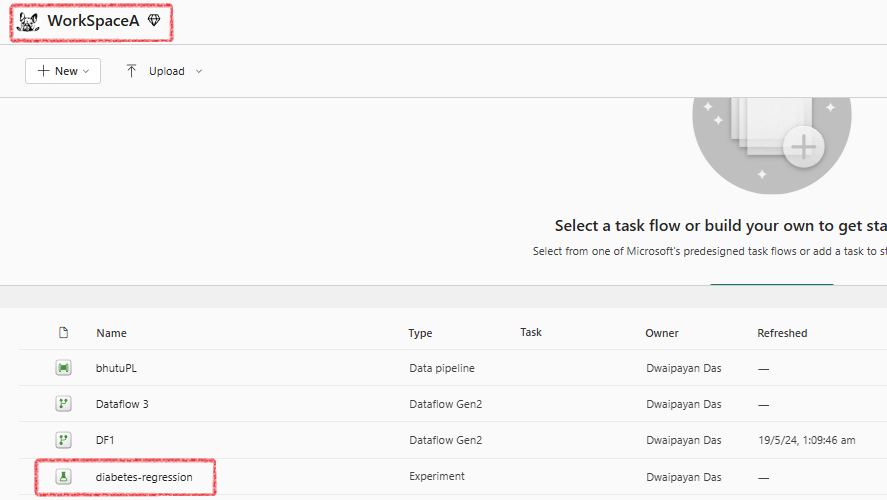
- Review Run metrics.
- Click
Save run as ML Modelto save it