Whats in your df? Find out quick.
When working with a dataframe, you often need to understand its structure, statistics, and null values - essentially, you want to ‘profile’ the dataset. Here’s how you can do it quickly in Fabric notebook.
Firs step - Use the display() Function
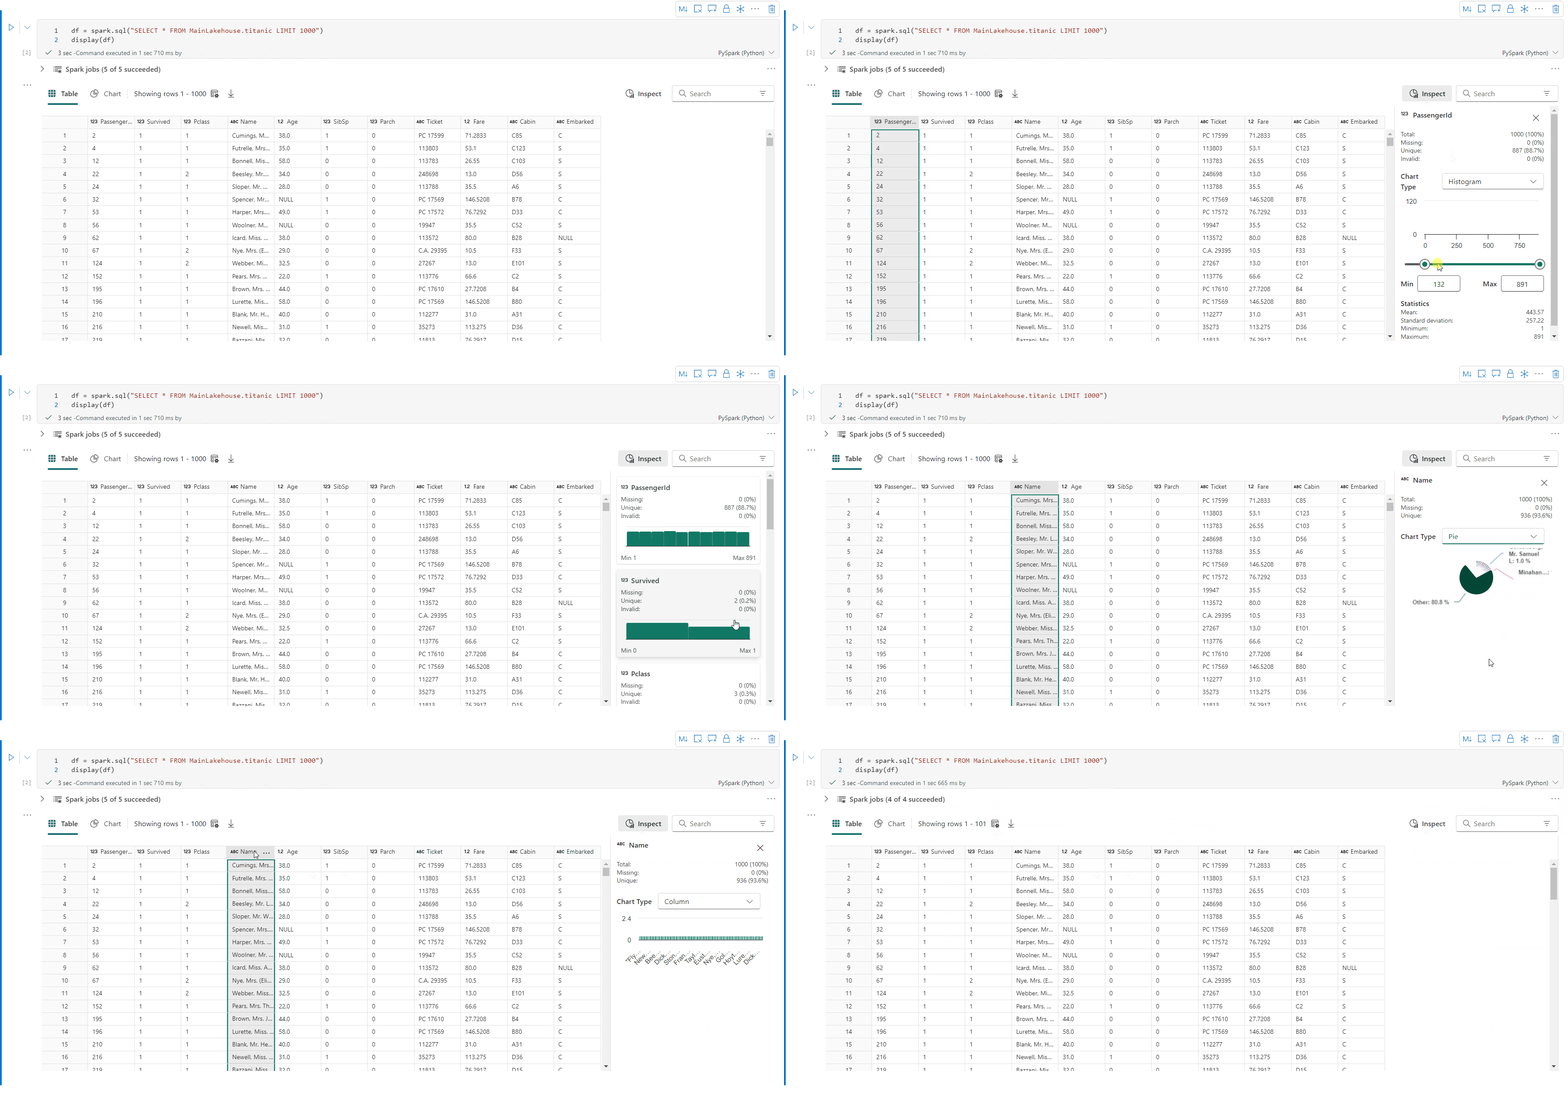
The first step is to use the display() function. This will produce a rich table and chart view, displaying it directly in the output.
display(df)
Once you have displayed your df using df(). You can use the Table view Chart view and Inspect(Table view) option. Lets explore them one by one.
Table View
The table view allows you to view the data in a tabular format. Follow these steps to inspect your dataframe:
- View the Data: The data is displayed in a table format.
- Click on the
InspectButton: This is a powerful tool for a detailed inspection of your dataframe.

- Explore Further: Use the
Inspectbutton to delve deeper into your dataframe.

Chart View
The chart view provides a visual representation of your data. Here’s how to get started:
- Switch to Chart View: Click on the chart view icon.
- Automatic Key-Value Pair: Fabric will automatically generate a key-value pair to get you started.
- Aggregate Data: You can then aggregate and analyze the data as needed.

Creating a Power BI Report
You can also create a real-time Power BI report using your dataframe with the following code:
# Create a Power BI report object from spark dataframe
from powerbiclient import QuickVisualize, get_dataset_config
PBI_visualize = QuickVisualize(get_dataset_config(df))

# Render new report
PBI_visualize

Microsoft Fabric DP-600 question
In your fabric Notebook you have a dataframe. You want to profile the dataframe - want to find the the columns, which columsn are empty etc etc.
What would the easiest way to do it?
Options:
- Create a pandas DataFrame first, and then visualize the data in an embedded Microsoft Power BI report by running QuickVisualize method on the pandas DataFrame.
- Display the DataFrame by running display(df), and then clicking the Inspect button.
- Display the DataDrame by running display(df), and then switching to chart view.
- Visualize the data in an embedded Microsoft Power BI report by running the QuickVisualize method on the DataFrame.
Answer: Use the Inspect(Table view) option
