Whats in your df? Find out quick.
When working with a dataframe, you often need to understand its structure, statistics, and null values - essentially, you want to 'profile' the dataset. Here's how you can do it quickly in Fabric notebook.
Firs step - Use the display() Function
The first step is to use the display() function. This will produce a rich table and chart view, displaying it directly in the output.
Table View
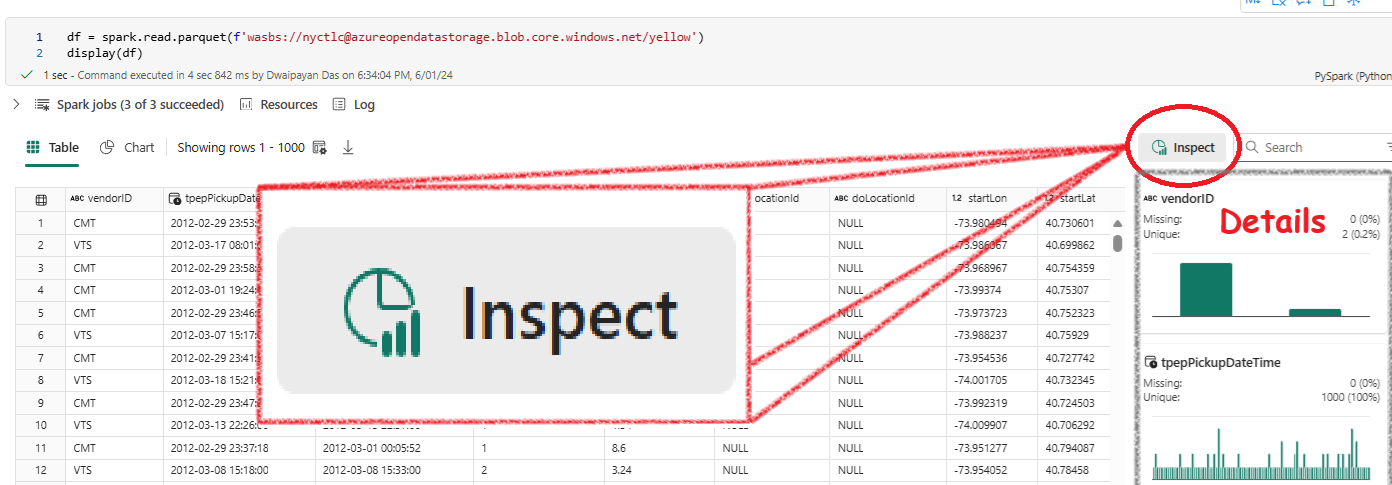
The table view allows you to view the data in a tabular format. Follow these steps to inspect your dataframe:
- View the Data: The data is displayed in a table format.
- Click on the
InspectButton: This is a powerful tool for a detailed inspection of your dataframe.
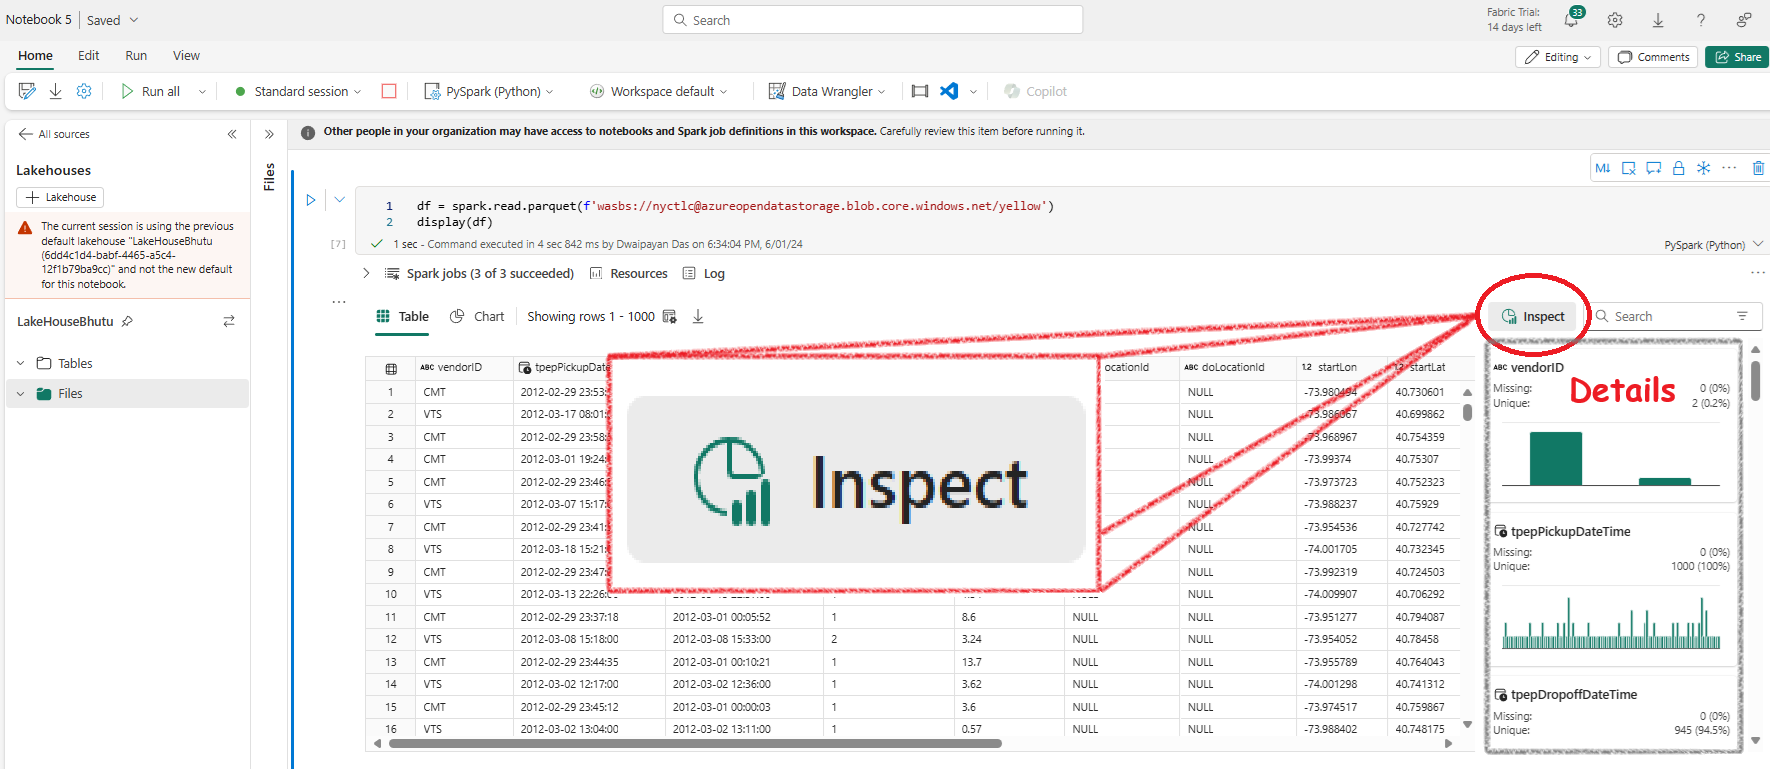
- Explore Further: Use the
Inspectbutton to delve deeper into your dataframe.
Chart View
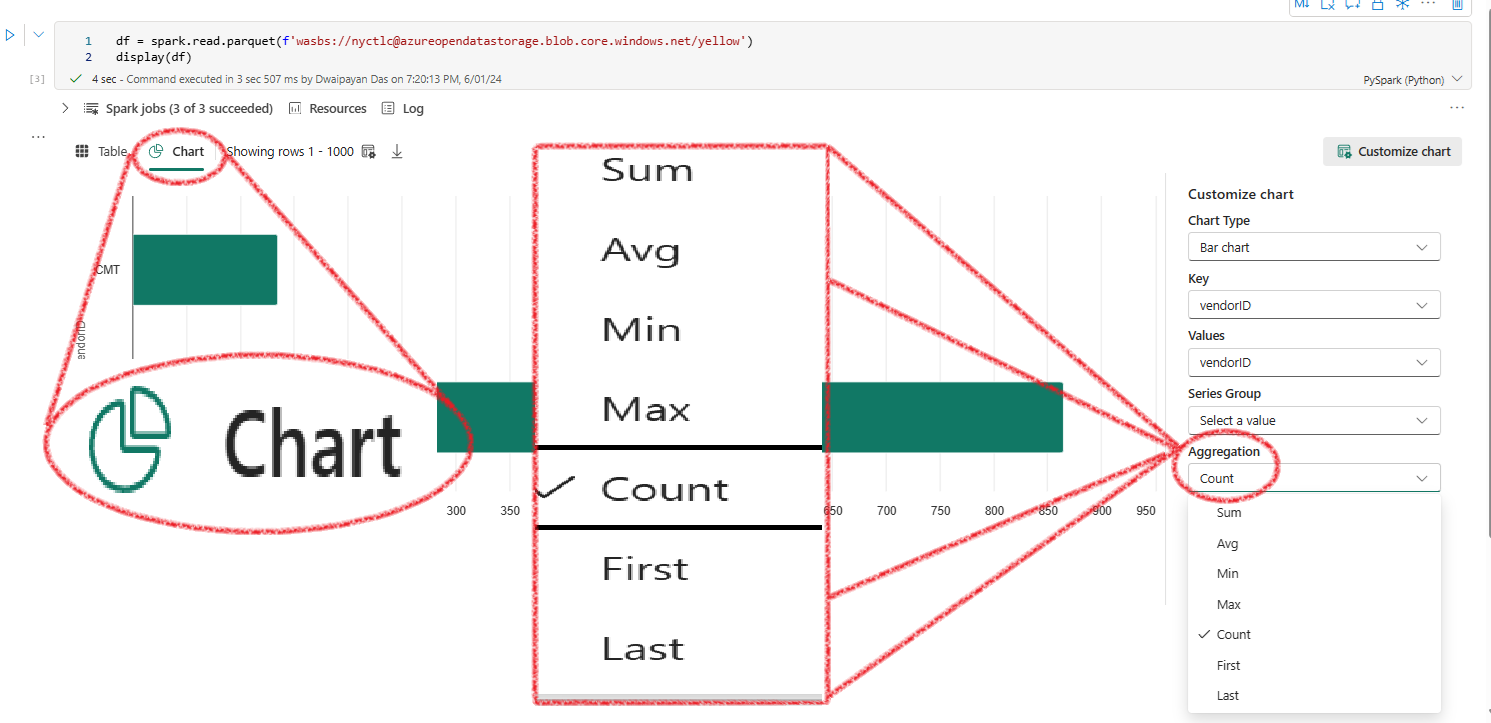
The chart view provides a visual representation of your data. Here's how to get started:
- Switch to Chart View: Click on the chart view icon.
- Automatic Key-Value Pair: Fabric will automatically generate a key-value pair to get you started.
- Aggregate Data: You can then aggregate and analyze the data as needed.
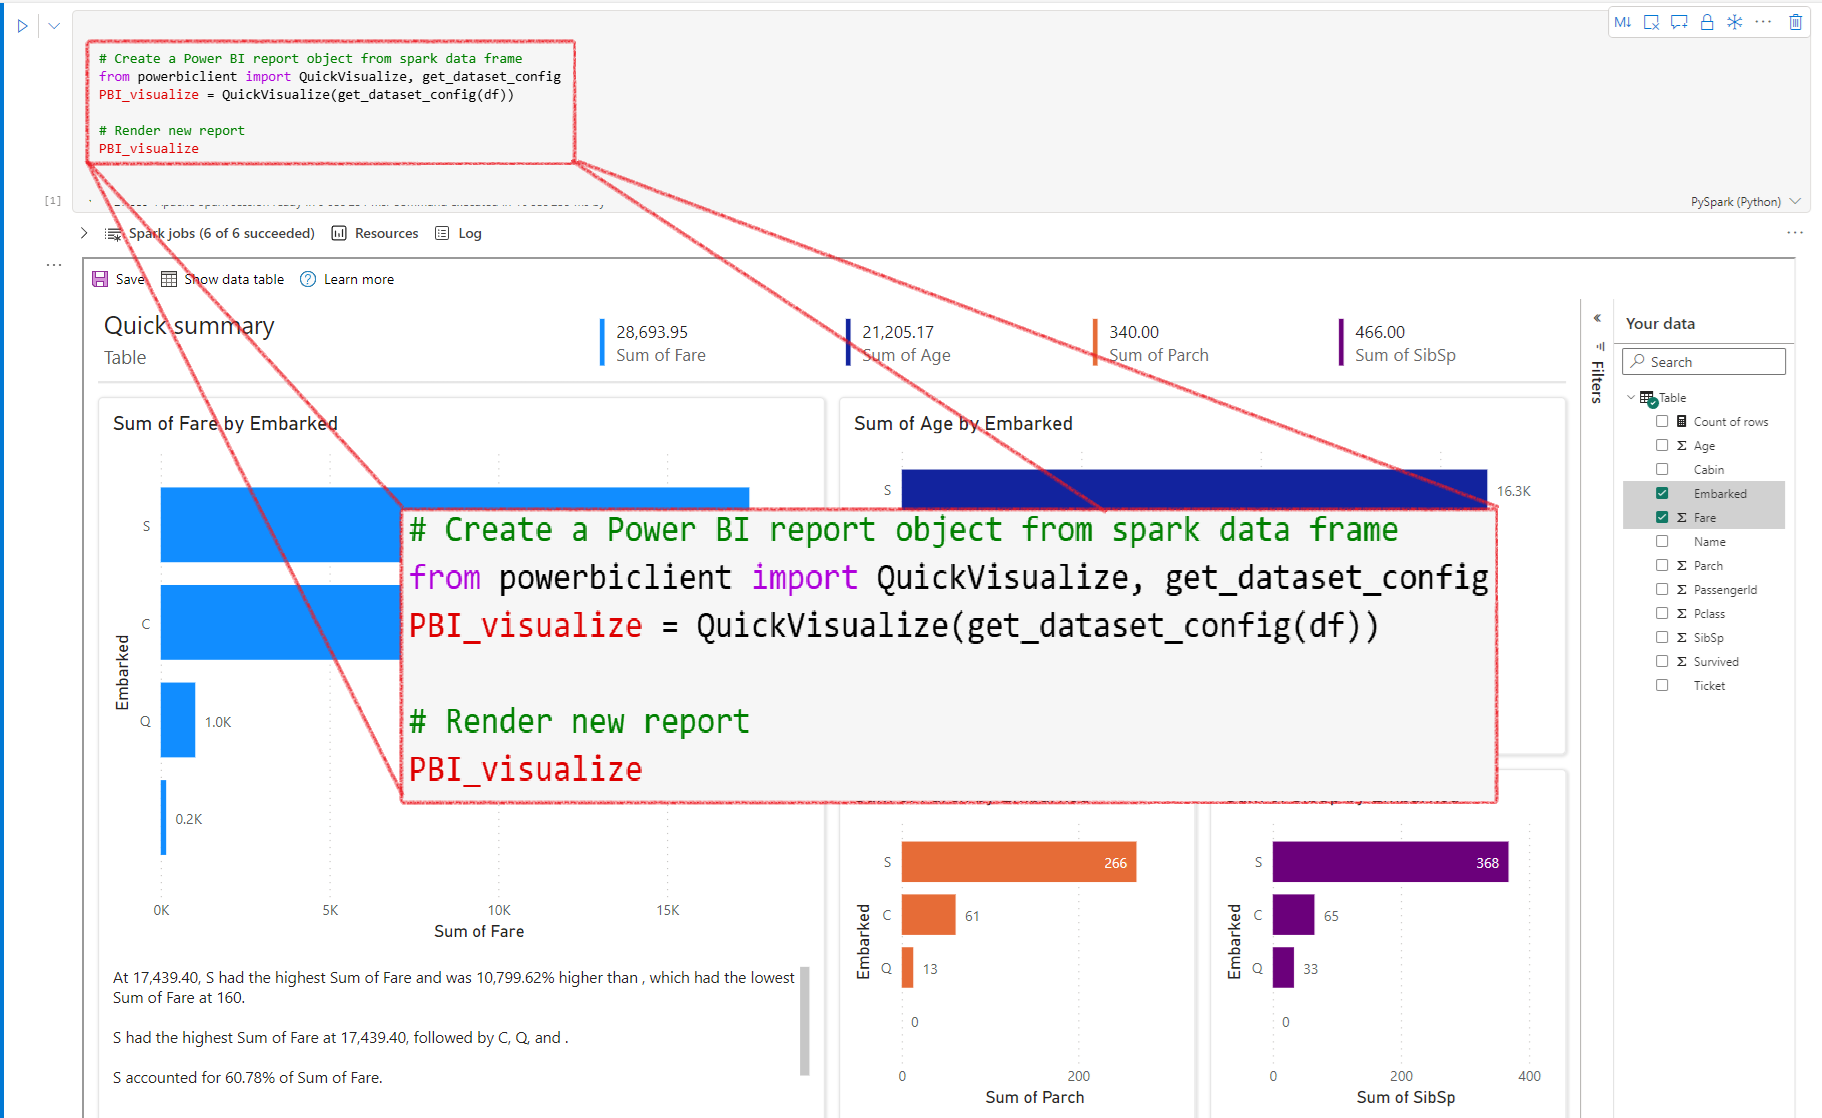
Creating a Power BI Report
You can also create a real-time Power BI report using your dataframe with the following code:
# Create a Power BI report object from spark dataframe
from powerbiclient import QuickVisualize, get_dataset_config
PBI_visualize = QuickVisualize(get_dataset_config(df))

# Render new report
PBI_visualize
Microsoft Fabric DP-600 question
In your fabric Notebook you have a dataframe. You want to profile the dataframe - want to find the the columns, which columsn are empty etc etc.
What would the easiest way to do it?
Options:
- Create a pandas DataFrame first, and then visualize the data in an embedded Microsoft Power BI report by running QuickVisualize method on the pandas DataFrame.
- Display the DataFrame by running display(df), and then clicking the Inspect button.
- Display the DataDrame by running display(df), and then switching to chart view.
- Visualize the data in an embedded Microsoft Power BI report by running the QuickVisualize method on the DataFrame.
Answer: Use the Inspect(Table view) option