Data Warehouse in Microsoft Fabric
Background
If earth is a database then Sun is a warehouse. Fabric's warehouse is unique - built on the Lakehouse(Delta format). You can use Full T-SQL.
Two types of Warehouse available in Microsoft Fabric
In Microsoft Fabric, there are two types of warehouses
- SQL Endpoint:
- The SQL Endpoint is auto-generated when you create a Lakehouse in Fabric.
- It serves as an analytics endpoint, allowing you to query data within the Lakehouse using T-SQL (Transact-SQL) language and the TDS (Tabular Data Stream) protocol.
- Each Lakehouse has one SQL analytics endpoint, and a workspace can have multiple Lakehouses.
- The SQL analytics endpoint exposes Delta tables from the Lakehouse as SQL tables, making them accessible via T-SQL queries.
- It also automatically creates a default Power BI semantic model based on the Lakehouse objects' naming conventions.
- No user action is required to create a SQL analytics endpoint; it is generated automatically during Lakehouse creation.
- Behind the scenes, the SQL analytics endpoint leverages the same engine as the Warehouse, ensuring high performance and low latency for SQL queries.
-
Automatic metadata discovery keeps SQL metadata up to date without user intervention.
-
Synapse Data Warehouse:
- The Synapse Data Warehouse is a SQL engine designed specifically for querying and transforming data within the Data Lake (OneLake).
- It provides full transactional support, including DDL (Data Definition Language) and DML (Data Manipulation Language) queries.
- With the Synapse Data Warehouse, you can perform cross-database queries and seamlessly transition from read-only operations to building business logic on your OneLake data.
- It complements the Lakehouse by enabling more complex analytics scenarios.
Fact and Dimension Table Concepts
Fact tables have the numbers you want to look at, like a receipt. They have a lot of rows and are the main source of data for analysis. They're like the "what" you are measuring.

Dimension tables have details about those numbers, like a restaurant menu. They have fewer rows and give context to the data in the fact tables.

Examples:
| Column | Fact Table | Dimension Table |
|---|---|---|
| Sales Amount | ✔ | |
| Order Quantity | ✔ | |
| Product ID | ✔ | |
| Customer ID | ✔ | |
| Transaction Date | ✔ | |
| Product Name | ✔ | |
| Customer Name | ✔ | |
| Supplier ID | ✔ | |
| Supplier Name | ✔ | |
| Discount Rate | ✔ | |
| Revenue | ✔ | |
| Store Location | ✔ | |
| Category | ✔ | |
| Time (Hour, Day, Month, Year) | ✔ | |
| Payment Method | ✔ |
Surrogate keys and alternte keys
Surrogate key: A unique key for each row. Like a cop's badge number. Its unique in the police department.
Alternate key: Its like a key that identifies the person in the whole ecosystem. Like a passport number of the cop - unique in the nation.

How data is ingested into a warehouse in Fabric?
Data is ingested using: Pipelines, Dataflows, cross-database querying, and the COPY INTO command.
COPY into syntax
COPY INTO dbo.apple
FROM 'https://abc/xxx.csv' WITH (
            FILE_TYPE = 'CSV'
            ,CREDENTIAL = (
                IDENTITY = 'Shared Access Signature'
                , SECRET = 'xxx'
                )
            ,FIRSTROW = 2
            )
GO
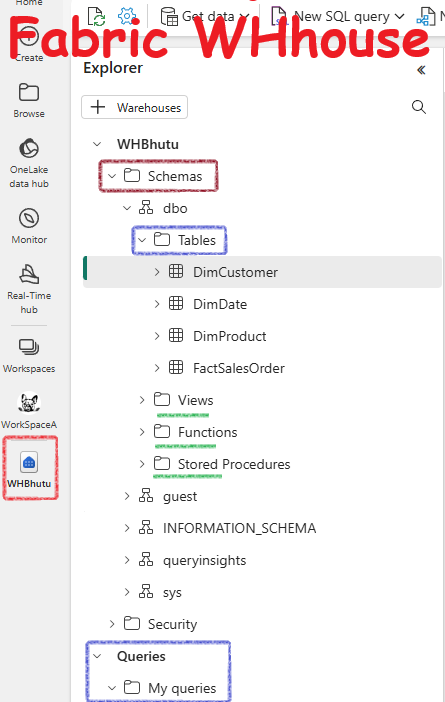
Fabric Datawarehouse interface
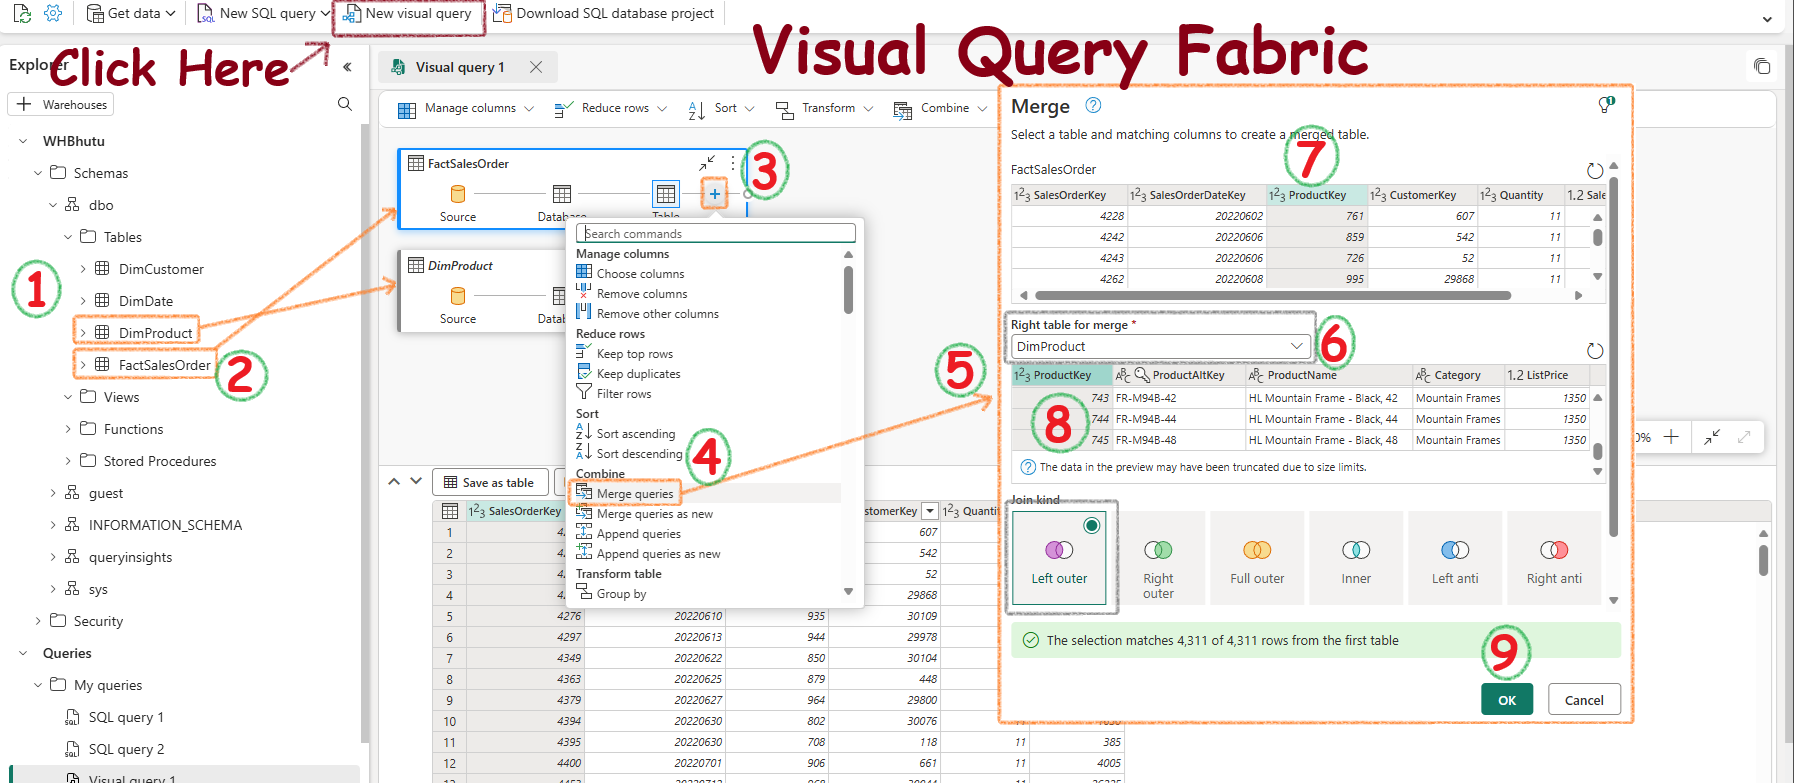
Visual Query in Fabric
Here I will show you how easy it is to create a left-outer join of Two tables - DimProduct & FactSalesOrder
Just drag both the tables on to the canvas then perform the steps as shown in the image below
Then select the required column. Here we selected ProductName.
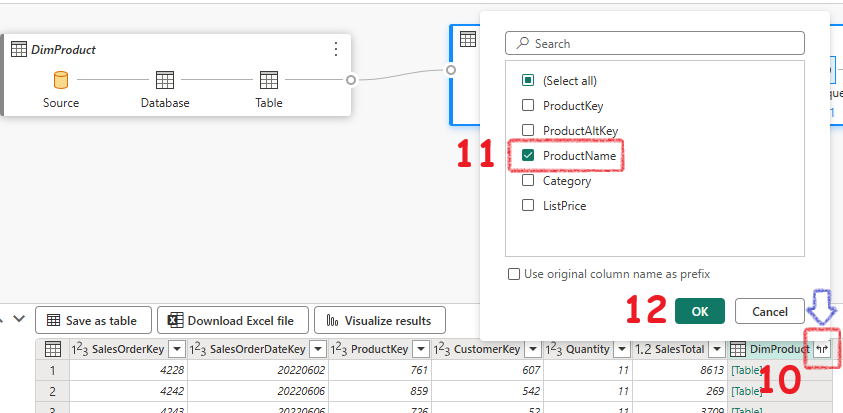
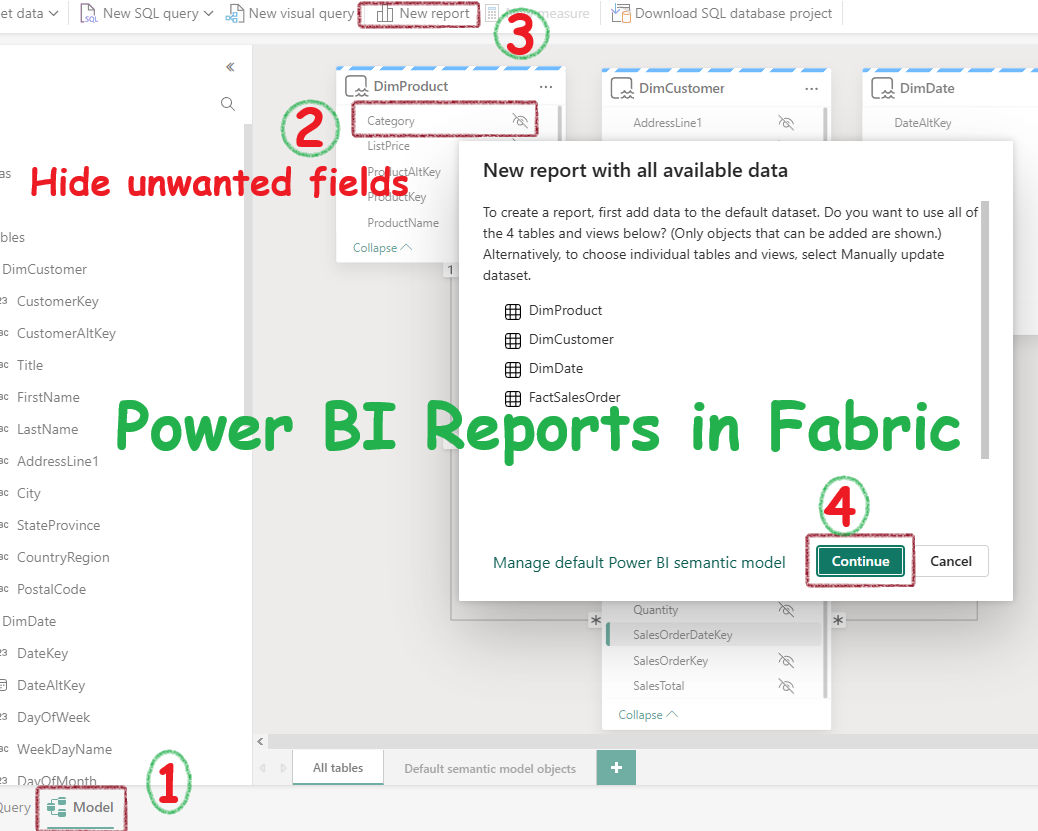
Then create a Power BI Reports quickly:
Appendix
Special Types of Dimension Tables
Special types of dimensions provide additional context and enable more comprehensive data analysis. Let's explore this with an example from a popular online retail company, "ShopEZ."
Time Dimensions
Time dimensions provide information about the time period in which an event occurred. This table enables data analysts to aggregate data over temporal intervals. For example, a time dimension might include columns for the year, quarter, month, and day in which a sales order was placed.
Example: Sales Analysis at ShopEZ
ShopEZ wants to analyze its sales performance to optimize inventory and marketing strategies. The time dimension table allows them to aggregate sales data over different periods.
- Year: 2023
- Quarter: Q1
- Month: January
- Day: 15
With these time dimensions, ShopEZ can easily aggregate sales data to see trends like:
- Increased sales during holiday seasons
- Monthly sales growth
- Quarterly performance comparison
Slowly Changing Dimensions (SCD)
Slowly changing dimensions track changes to dimension attributes over time, like changes to a customer's address or a product's price. They are crucial in a data warehouse because they allow users to analyze and understand changes to data over time.
Example: Customer Loyalty Program at Wallmart
ShopEZ runs a loyalty program where customers' membership tiers can change based on their purchase history. Tracking these changes accurately over time is essential for targeted marketing and personalized offers.
Scenario: Change in Customer's Membership Tier
- Original Record (2022):
- Customer ID: 456
- Name: Sarah Lee
- Membership Tier: Silver
-
Join Date: 2021-05-10
-
Updated Record (2023):
- Customer ID: 456
- Name: Sarah Lee
- Membership Tier: Gold
- Join Date: 2021-05-10
In a slowly changing dimension scenario, ShopEZ's data warehouse can handle this change using different SCD types:
- Type 1 (Overwrite): The old membership tier is overwritten with the new tier. This approach is straightforward but loses historical data.
- Customer ID: 456
- Name: Sarah Lee
- Membership Tier: Gold
-
Join Date: 2021-05-10
-
Type 2 (Historical Tracking): A new record is created for Sarah to preserve the history of changes. This method adds a new row for each change and typically includes an effective date range.
- Record 1:
- Customer ID: 456
- Name: Sarah Lee
- Membership Tier: Silver
- Join Date: 2021-05-10
- End Date: 2023-01-14
-
Record 2:
- Customer ID: 456
- Name: Sarah Lee
- Membership Tier: Gold
- Join Date: 2021-05-10
- Start Date: 2023-01-15
-
Type 3 (Limited History): The old value is stored in additional columns, allowing some history tracking but limited to a predefined number of changes.
- Customer ID: 456
- Name: Sarah Lee
- Current Membership Tier: Gold
- Previous Membership Tier: Silver
- Join Date: 2021-05-10
Real-Life Impact
Using time dimensions, ShopEZ can identify that sales peak during certain times, such as Black Friday or Christmas. This insight helps them plan inventory, staffing, and marketing campaigns more effectively.
With slowly changing dimensions, ShopEZ can track changes in customer behavior and preferences over time. For example, they can see that Sarah Lee upgraded her membership tier from Silver to Gold, indicating increased engagement and spending.