Getting Started with Microsoft Fabric
What is Microsoft Fabric?
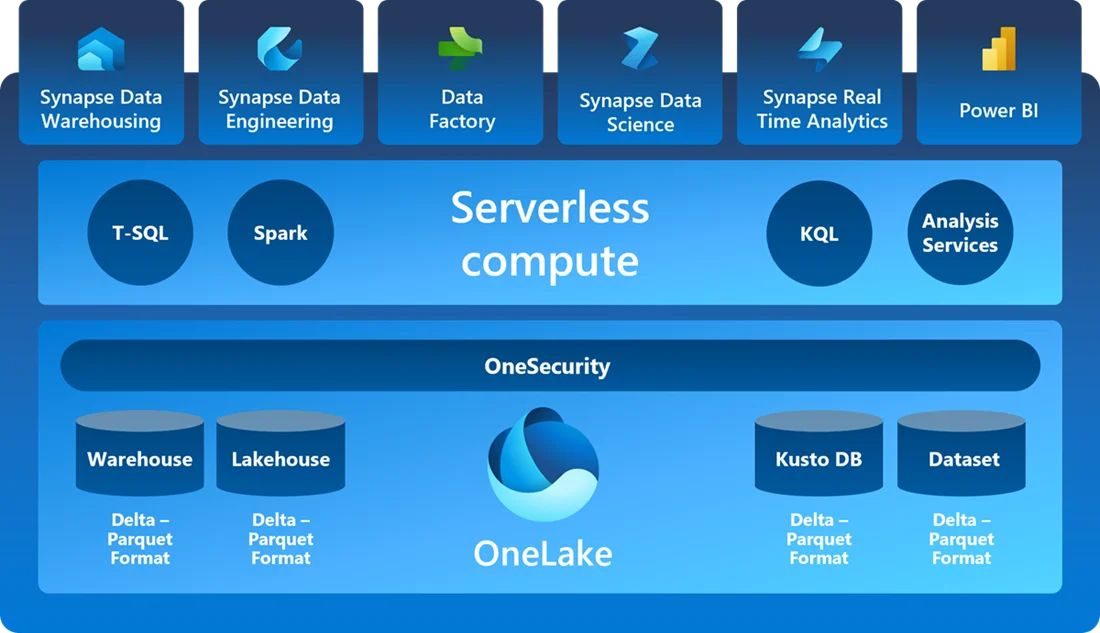
Microsoft Fabric is a one-stop, low-to-no-code analytics platform that brings together various data tools under a single environment.
Core Components
- OneLake - Central data storage
- Data Engineering - Apache Spark & notebook experiences
- Data Factory - Data pipeline experiences
- Data Science - Machine learning experiences
- Real-time Analytics - Streaming & real-time analytics
- Power BI - Business intelligence & reporting
Understanding OneLake

OneLake is the foundation of Microsoft Fabric's data storage system.
| OneLake Feature | Description |
|---|---|
| Default allocation | Each fabric tenant receives one OneLake instance by default |
| Storage concept | Similar to OneDrive but for data (built on Azure Data Lake Storage) |
| Data handling | Import data directly or create shortcuts to external data |
| Default format | Delta Lake format |
Lakehouse Fundamentals
Lakehouse combines the best of Data Lakes and Data Warehouses.
A Lakehouse provides:
- Flexibility of storing raw data like a data lake
- Structure and performance of a data warehouse
- SQL querying capabilities on lake data
Pre-requisites for a Lakehouse
Before creating a lakehouse, you need to create a workspace in the Microsoft Fabric platform.
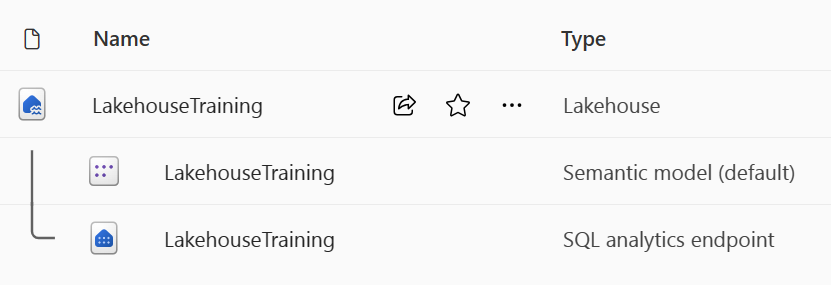
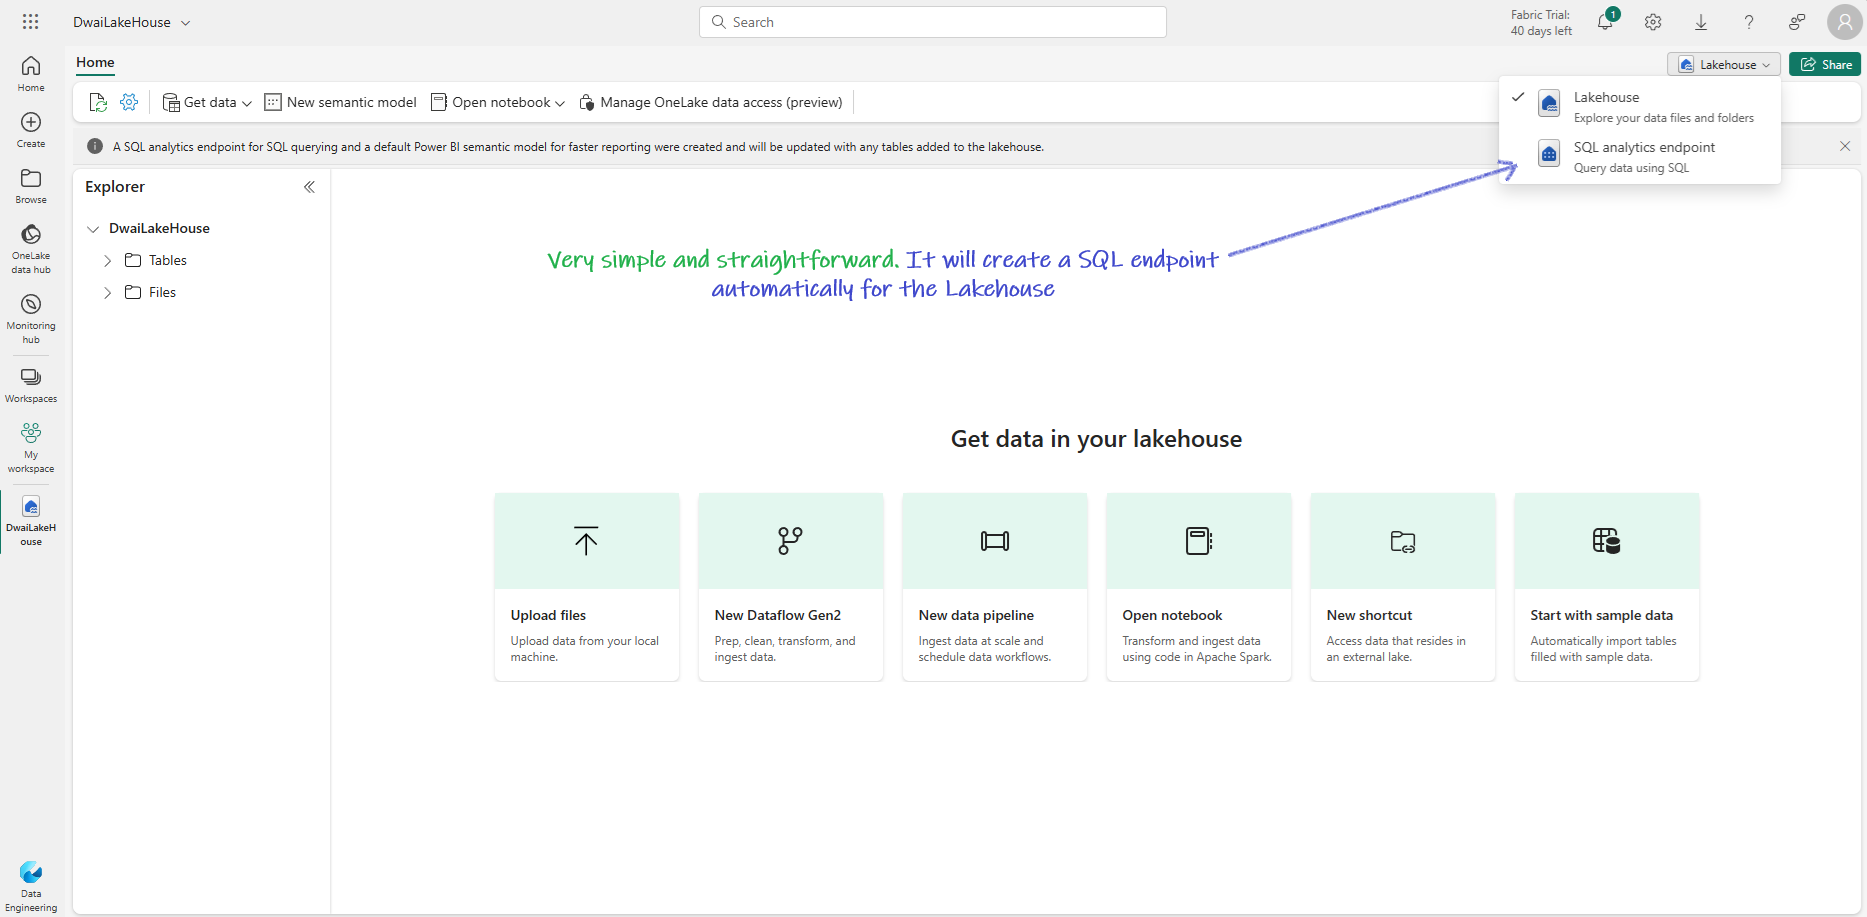
When you create a lakehouse in the Data Engineering workload, three items are produced:
- Lakehouse: Storage and metadata where you interact with files, folders, and table data
- Semantic model: Automatically created data model based on tables
- SQL Endpoint: Read-only endpoint for Transact-SQL queries
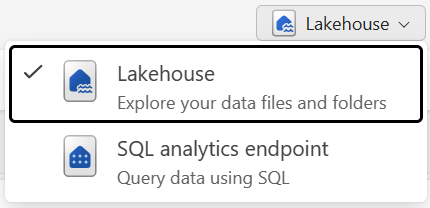
You can interact with the data in two modes:
- Lakehouse mode: Add and interact with tables, files, and folders
- SQL analytics endpoint: Query tables using SQL and manage data models
Shortcuts in Lakehouse
Shortcuts let you integrate external data into your lakehouse without moving it.
About Shortcuts
- Appear as folders in the lake
- Available in both lakehouses and KQL databases
- Accessible via Spark, SQL, Real-Time Analytics, and Analysis Services
- Source data permissions and credentials managed by OneLake
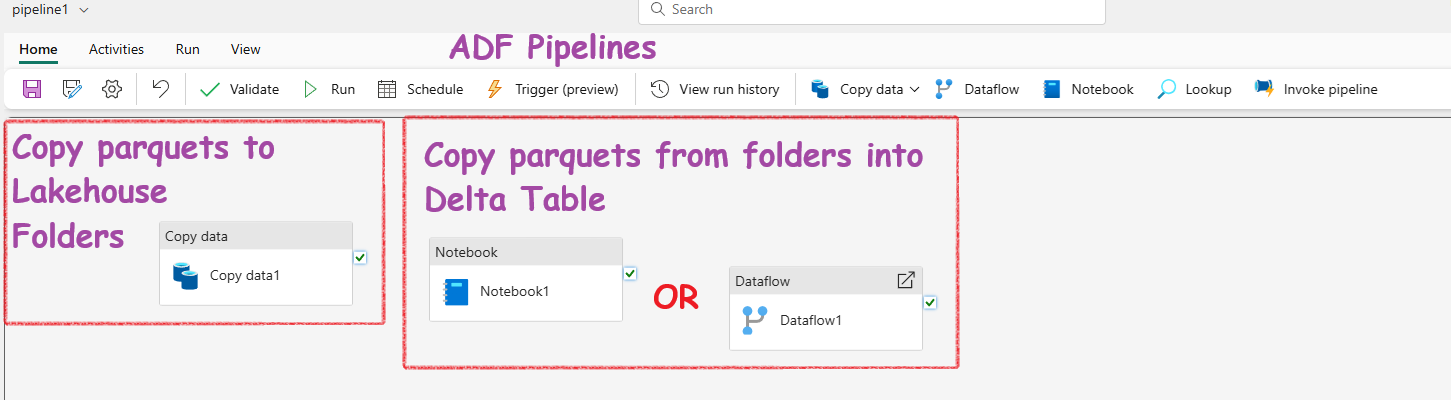
Data Ingestion Methods
There are multiple ways to get data into your lakehouse:
Upload local files or folders and load results into tables
Import and transform data from various sources using Power Query Online
Use notebooks to ingest, transform, and load data
Copy data and orchestrate processing activities
Data Transformation Methods
Choose from various transformation methods:
- Apache Spark: PySpark, SparkSQL, Notebooks, Spark job definitions
- SQL analytic endpoint: Transact SQL
- Dataflows (Gen2): Power Query
- Data pipelines: Orchestrated data flows
Visualization
Create end-to-end solutions using Power BI and Fabric Lakehouse.
Creating a Fabric Lakehouse
Create a Lakehouse Workspace
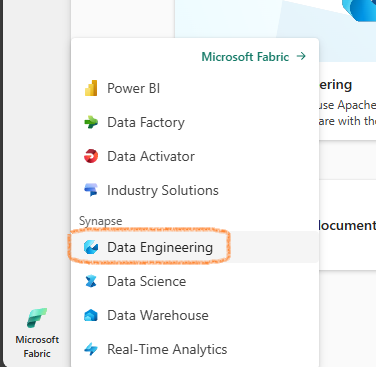
- Go to https://app.fabric.microsoft.com
- Select Synapse Data Engineering
Create a Lakehouse
- Click on Create then Lakehouse
- Give your Lakehouse a name
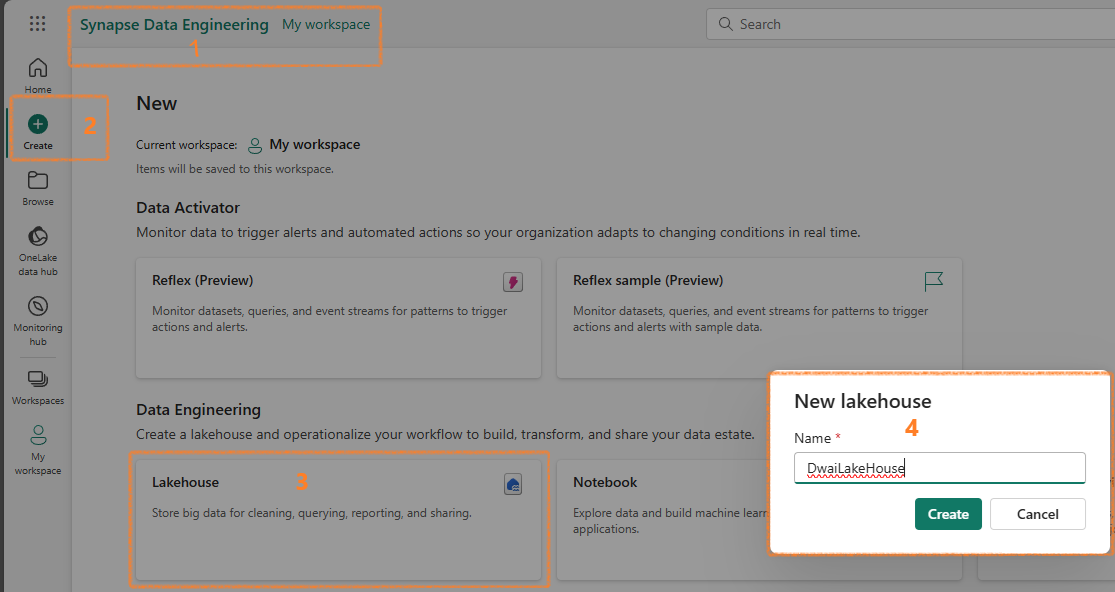
- Fabric will create everything automatically
Upload a Sample File
- Download the sample CSV file from https://raw.githubusercontent.com/MicrosoftLearning/dp-data/main/sales.csv
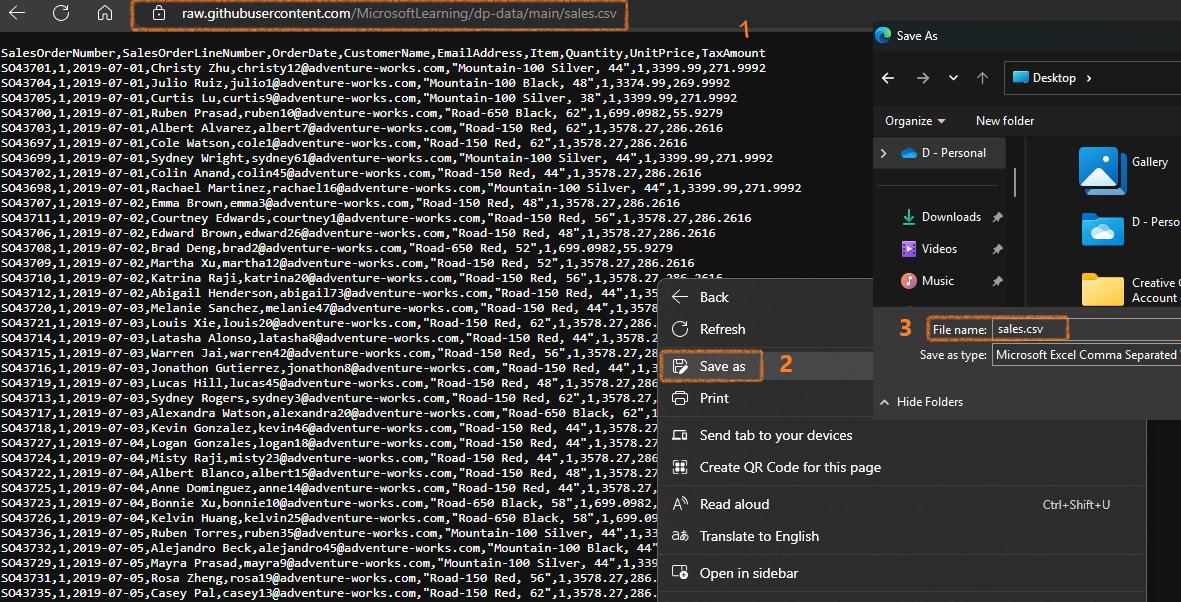
- Go to Explorer, create a Data subfolder under Files, then upload the CSV
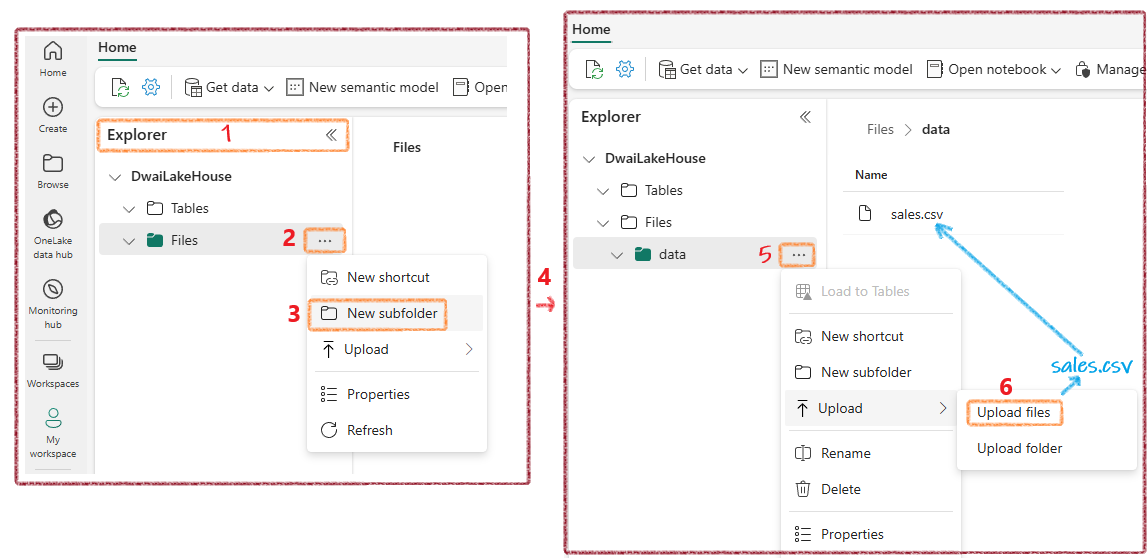
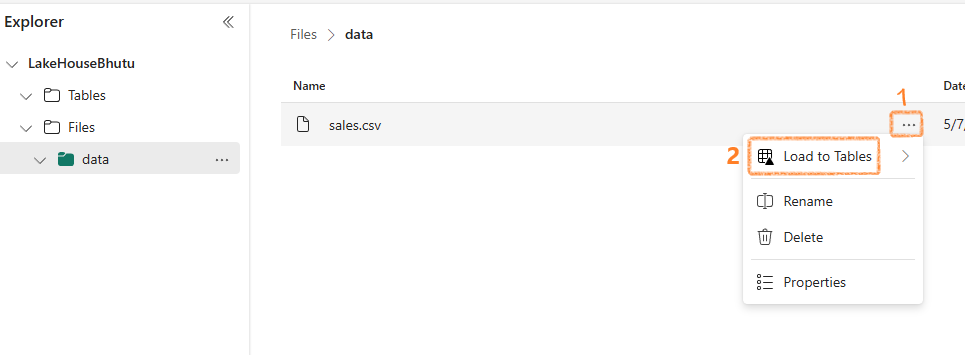
Load Data into a Table
To use SQL with your data, import it into a table:
- Click on the ellipsis (...) next to the CSV file
- Select Load to Tables
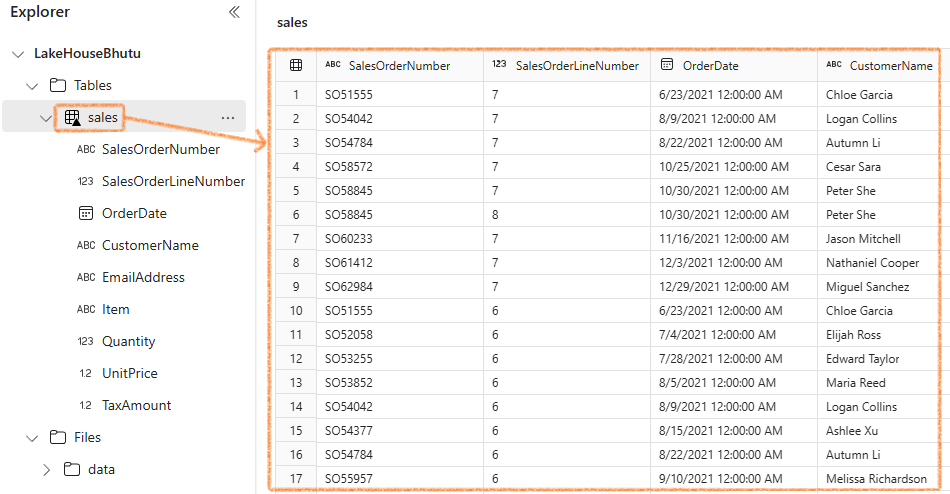
Once loaded, you can see your table in tabular format:
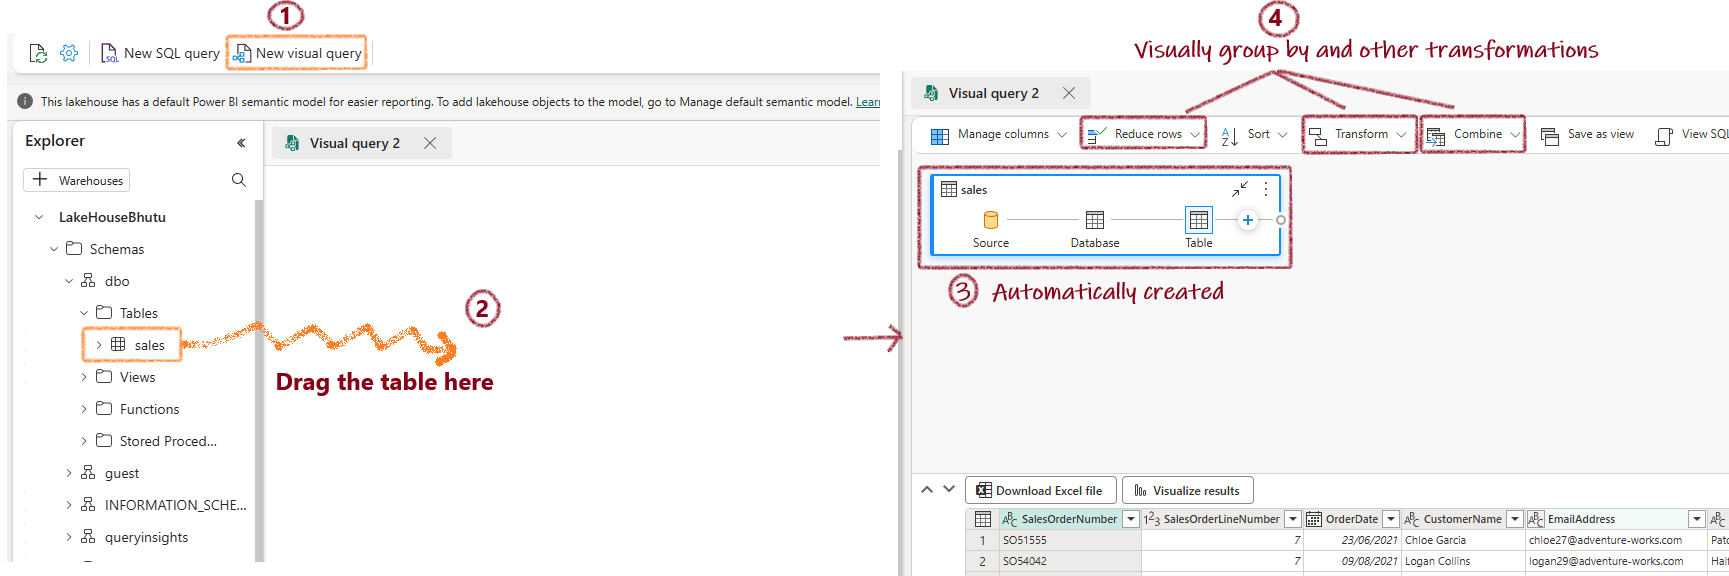
Query Data Using SQL
Standard SQL Query
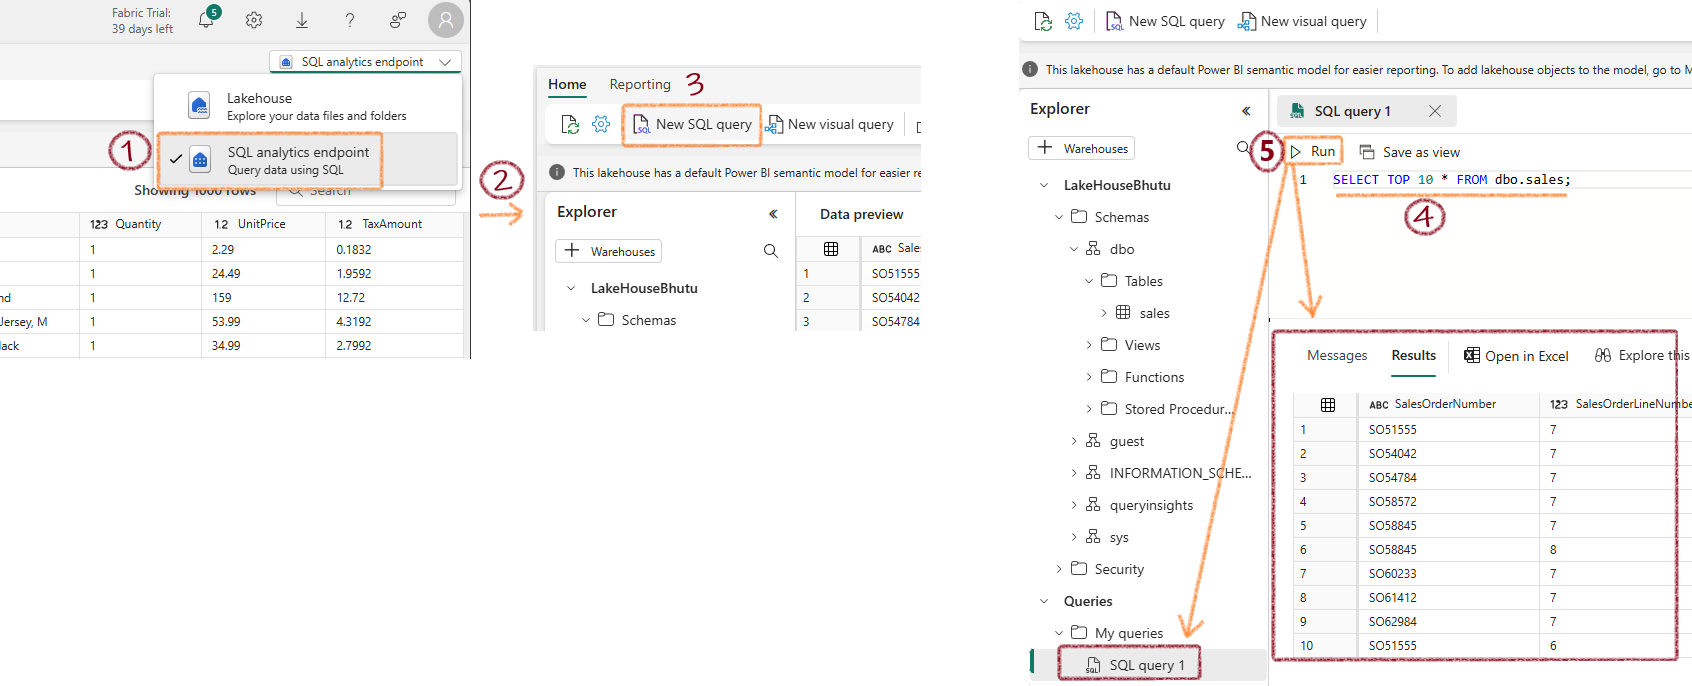
Visual Query
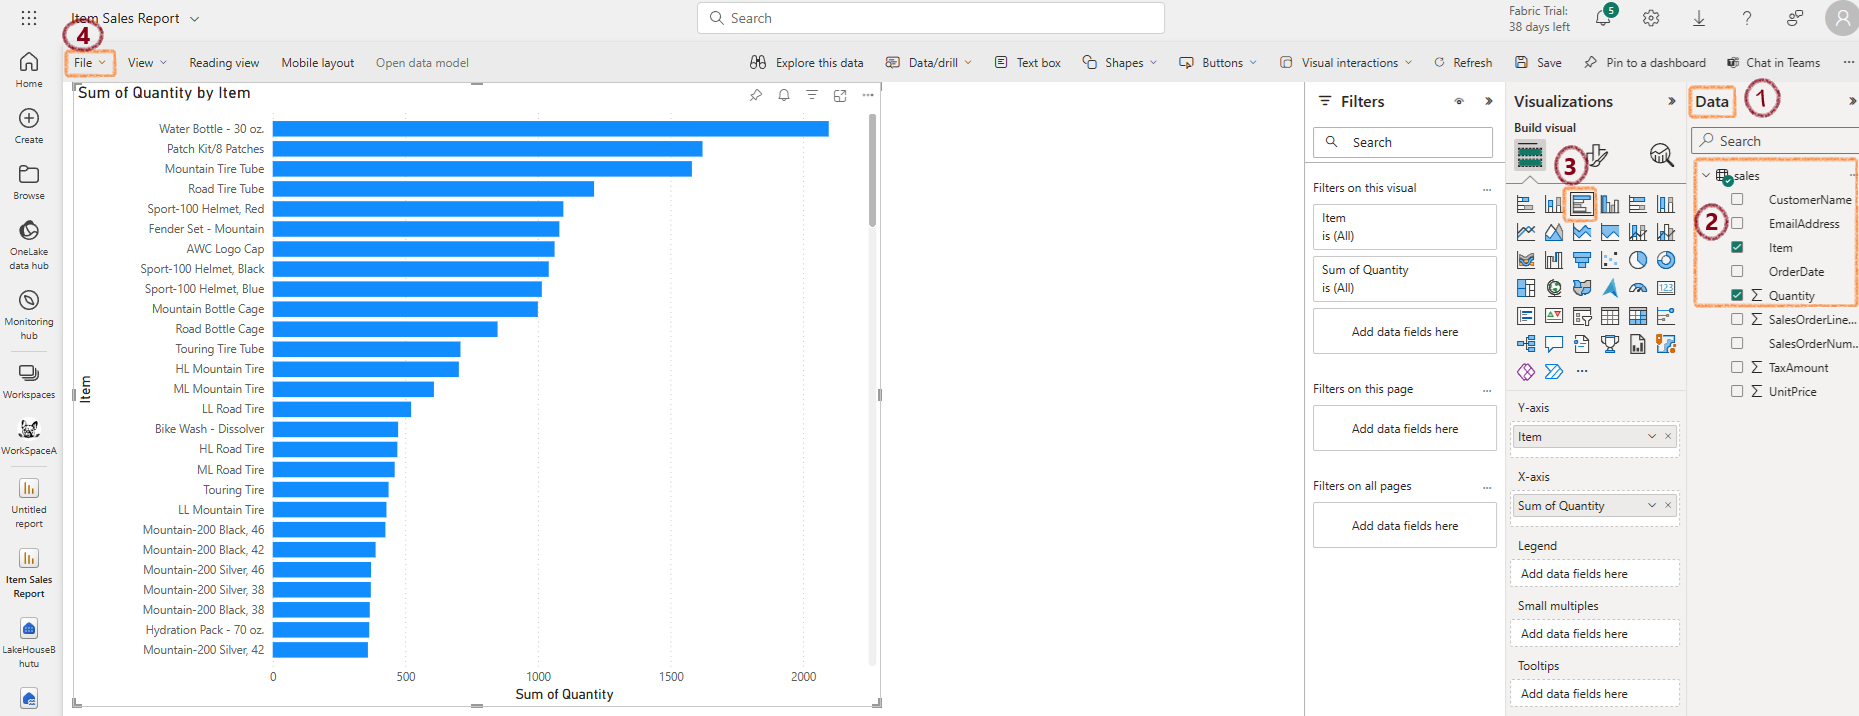
Create a Power BI Report
- At the bottom of the SQL Endpoint page, click the Model tab
- Navigate to the Reporting tab and select New report
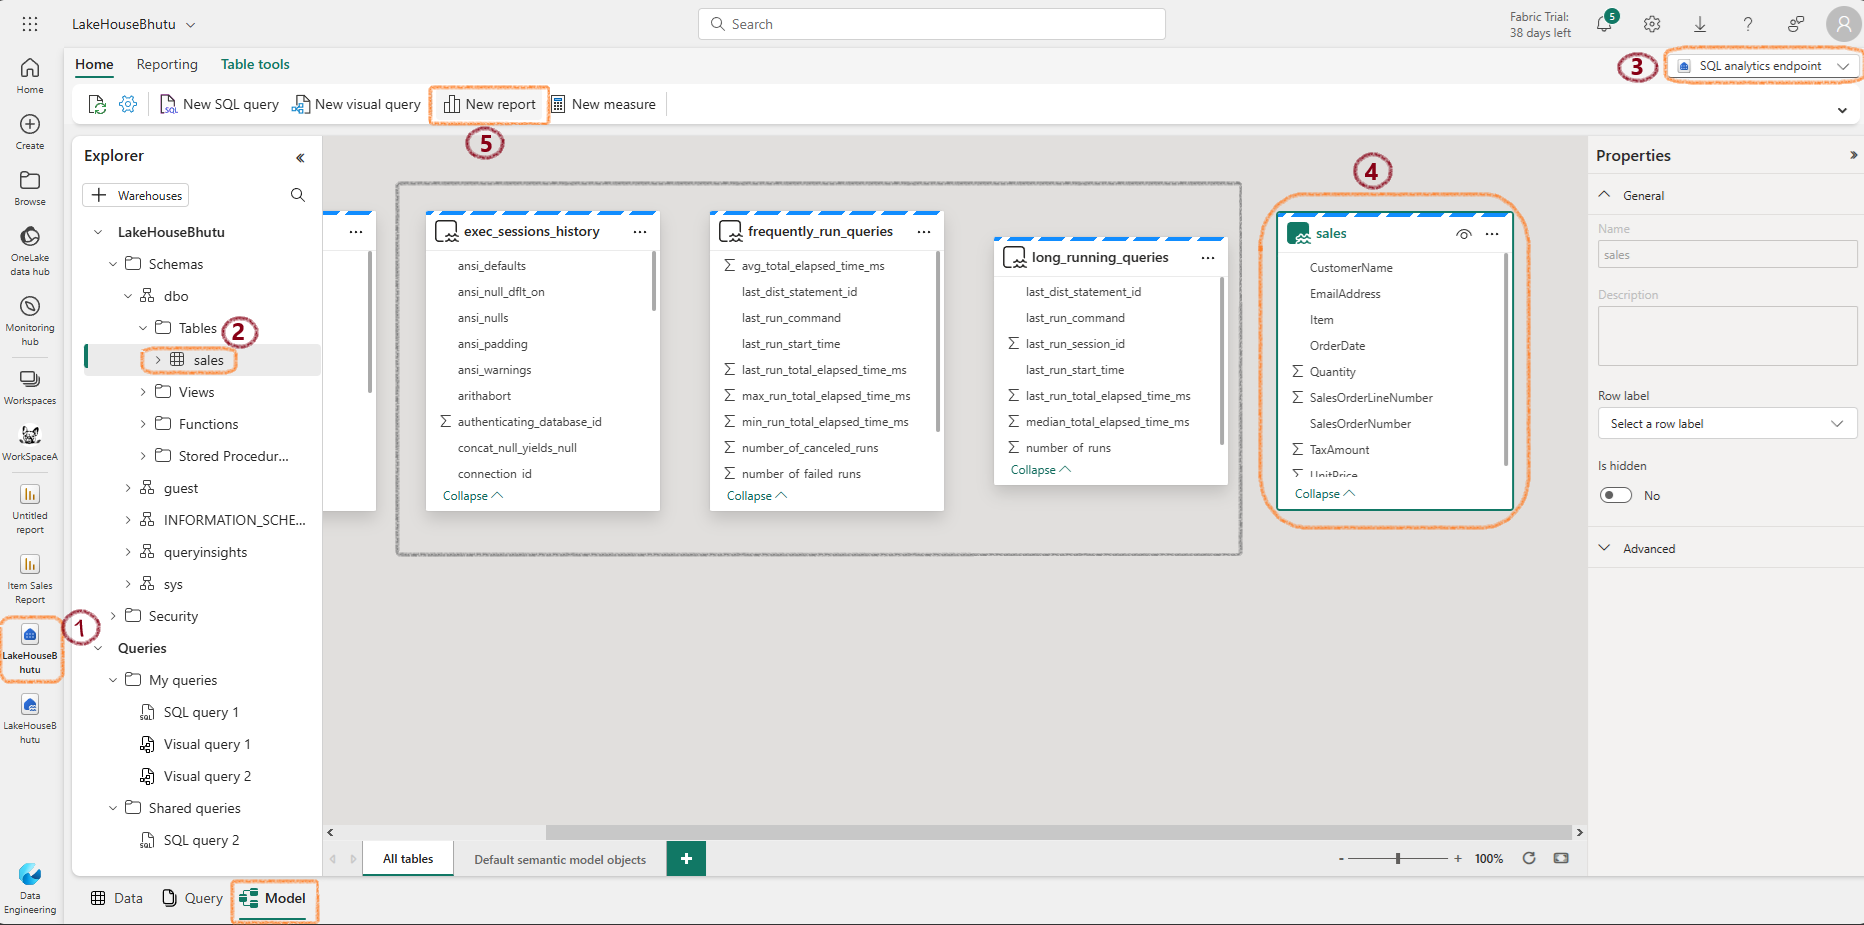
- In the Data pane, expand the sales table and select Item and Quantity
- Hide the Data and Filters panes to create more space
- Change the visualization to a Clustered bar chart and resize it
- Save the report as Item Sales Report
- Verify that your workspace contains:
- Your lakehouse
- SQL analytics endpoint
- Default semantic model
- Item Sales Report
Connect External Data Using Shortcuts
If you want to leave data external but access it from Fabric:
- Create shortcuts to external data sources like Dataverse
- The data appears as a folder in your Lakehouse
Warning
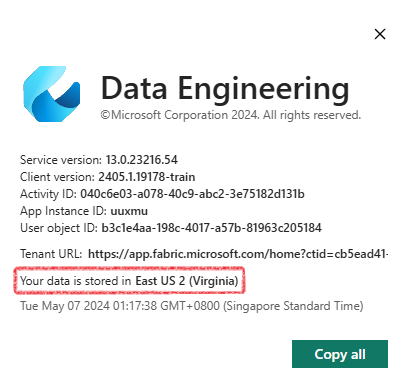
The region of Dataverse and Fabric should be the same.
Apache Spark in Microsoft Fabric
Spark divides and conquers large data processing jobs across multiple computers.
Key Points
- Each Fabric workspace gets one Spark cluster
- PySpark and SparkSQL are the most commonly used languages
- SparkContext handles the job splitting and distribution
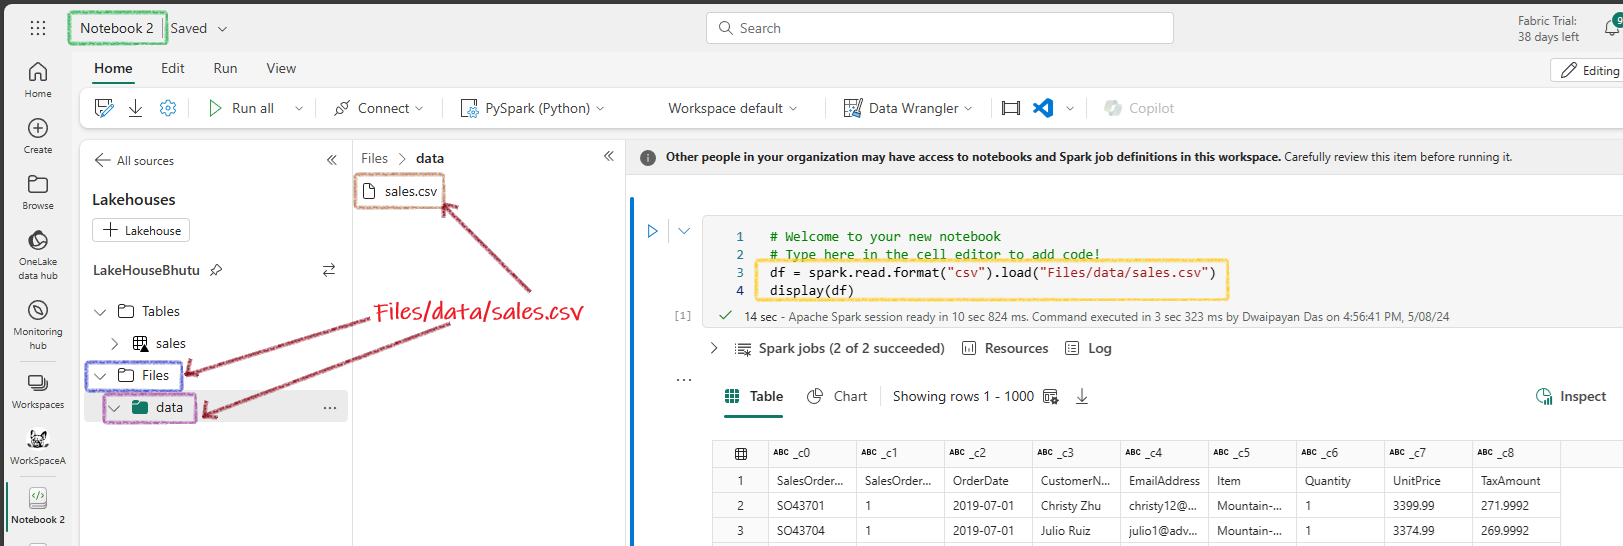
Running a Spark Notebook
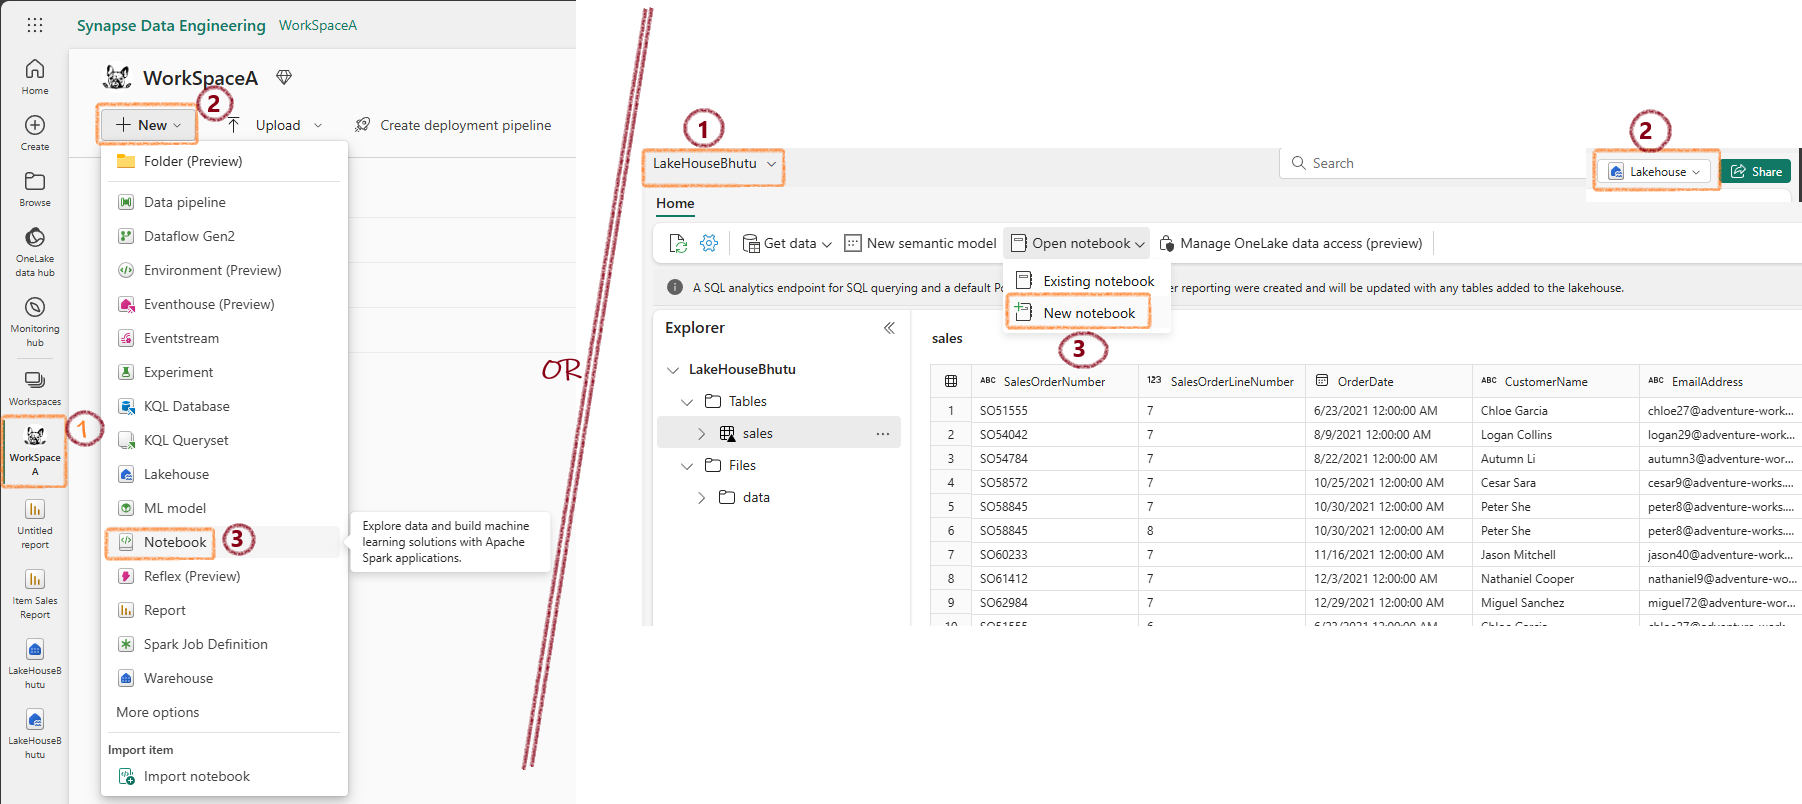
Running PySpark Code in a Notebook
Spark sessions are pre-created in Fabric notebooks. Just create dataframes and start coding!
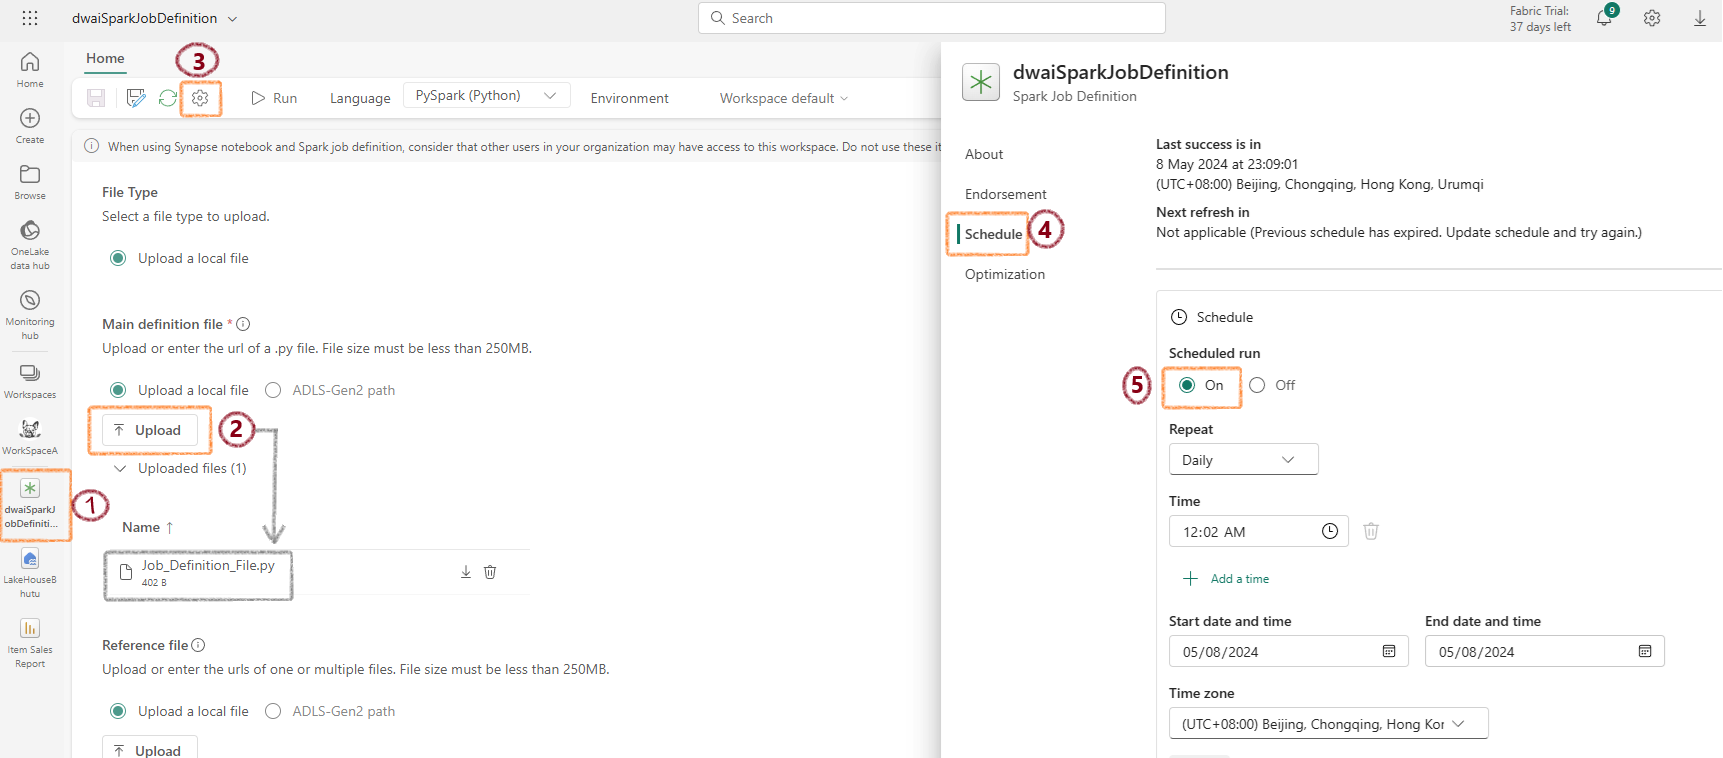
Creating a Spark Job Definition
- Access the Spark Job Definition page
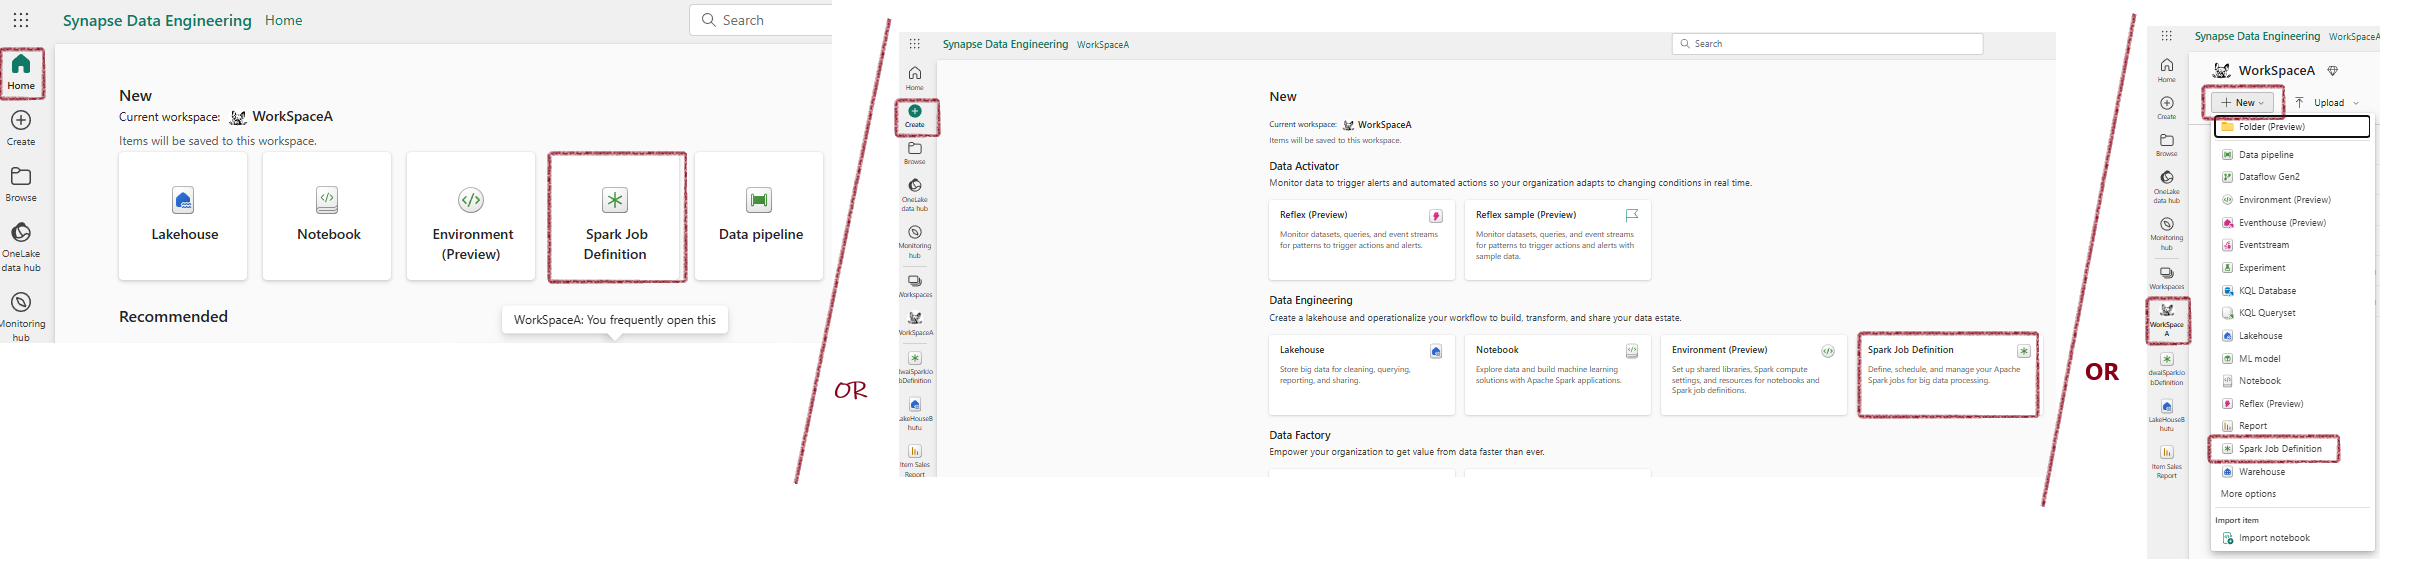
- Create a PySpark job definition
Develop a main definition file named anyname.py:
from pyspark.sql import SparkSession

# This code executes only when the .py file is run directly.
if __name__ == "__main__":
    # Initialize a Spark session specifically for this job.
    spark = SparkSession.builder.appName("Sales Aggregation").getOrCreate()
    # Read data from a CSV file into a DataFrame.
    df = spark.read.csv('Files/data/sales.csv', header=True, inferSchema=True)
    # Write the DataFrame to a Delta table, overwriting existing data.
    df.write.mode('overwrite').format('delta').save('Files/data/delta')
- Upload and schedule the file
Delta Lake in Microsoft Fabric
Delta Lake provides a SQL interface over data lakes. In Fabric, any table imported from CSV/Excel automatically becomes a Delta Lake table.
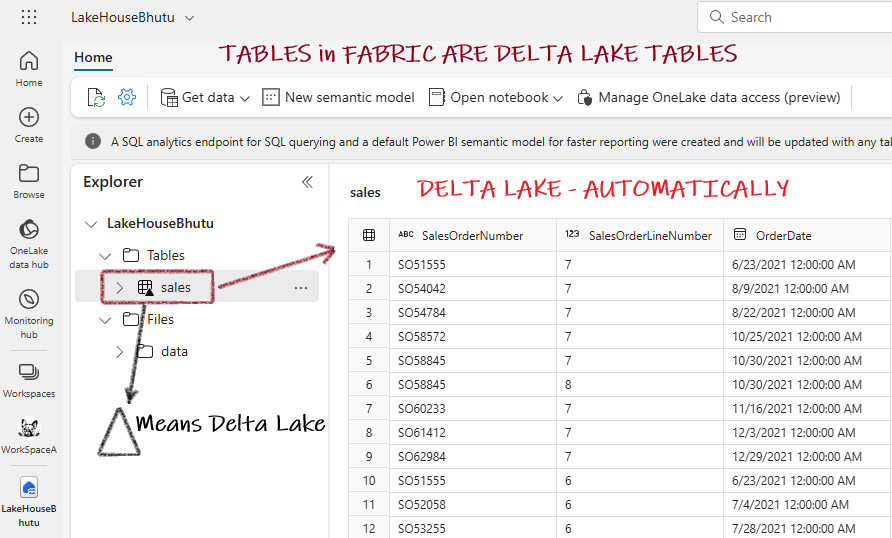
For these tables, you'll find:
* .parquet files
* _delta_log folders
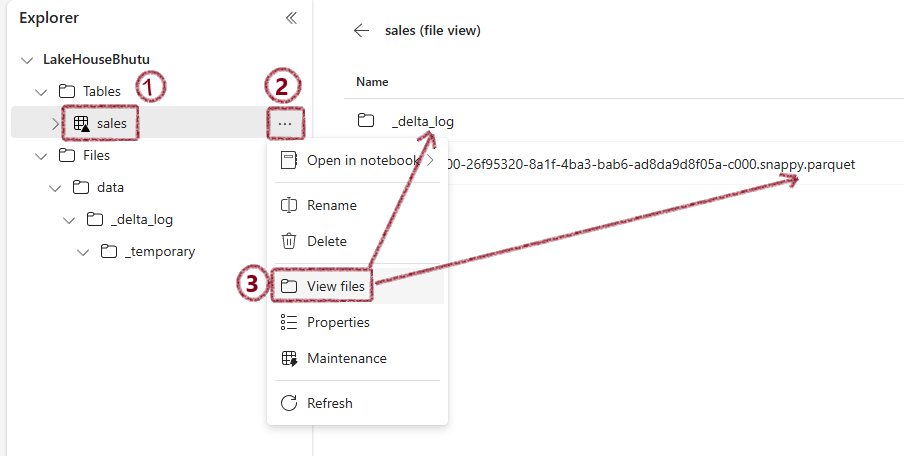
This automatic conversion to Delta format is a significant advantage - there's no need to convert files separately.
Delta Lake Tables
Using DataFrame Write Methods
Managed Table
External Table
Using DeltaTableBuilder API
from delta.tables import *

DeltaTable.create(spark) \
  .tableName("Planet") \
  .addColumn("Size", "INT") \
  .addColumn("Name", "STRING") \
  .execute()
Using Spark SQL
Create Managed Table
CREATE TABLE salesorders
(
    Orderid INT NOT NULL,
    OrderDate TIMESTAMP NOT NULL,
    CustomerName STRING,
    SalesTotal FLOAT NOT NULL
)
USING DELTA;
Create External Table
Insert Rows
Using SQL Magic
Working with Delta Files
You can save dataframes directly as Delta format without creating a table:
After running this code, you'll see:
1. Parquet files
2. _delta_log subfolder
Later, you can create a DeltaTable from the folder:
from delta.tables import *
from pyspark.sql.functions import *

# Create a DeltaTable object
delta_path = "Files/mytable"
deltaTable = DeltaTable.forPath(spark, delta_path)

# Update the table
deltaTable.update(
    condition = "Category == 'Accessories'",
    set = { "Price": "Price * 0.9" })
Time Travel
View all transactions to a table:
Access a specific version:
Access data as of a specific date:
Delta Lake - Spark Streaming
Using a Delta Table as a Streaming Source
from pyspark.sql.types import *
from pyspark.sql.functions import *

# Load a streaming dataframe from the Delta Table
stream_df = spark.readStream.format("delta") \
    .option("ignoreChanges", "true") \
    .load("Files/delta/internetorders")

# Process the streaming data
stream_df.show()
Using a Delta Table as a Streaming Sink
from pyspark.sql.types import *
from pyspark.sql.functions import *

# Create a stream that reads JSON data from a folder
inputPath = 'Files/streamingdata/'
jsonSchema = StructType([
    StructField("device", StringType(), False),
    StructField("status", StringType(), False)
])
stream_df = spark.readStream.schema(jsonSchema).option("maxFilesPerTrigger", 1).json(inputPath)

# Write the stream to a delta table
table_path = 'Files/delta/devicetable'
checkpoint_path = 'Files/delta/checkpoint'
delta_stream = stream_df.writeStream.format("delta").option("checkpointLocation", checkpoint_path).start(table_path)
Stop the stream when finished: